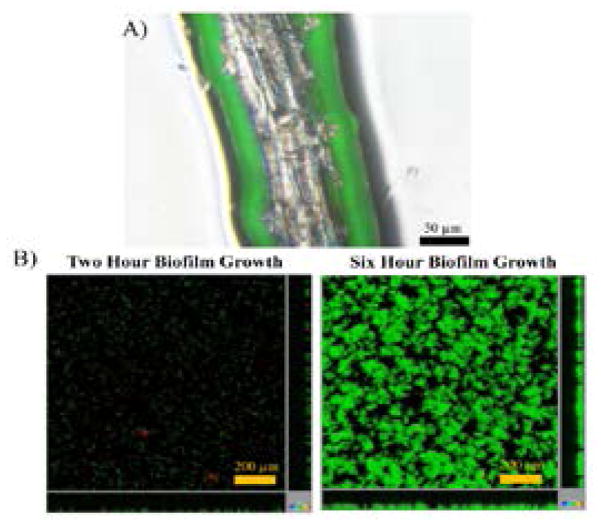
Figure 2.
Fluorescent microscopy of biofilms. Fluorescent images of biofilms. (A) Merged phase and fluorescent image of Arabidopsis thaliana roots colonized with EGFP expressing PA14. Overlays of fluorescence (green) and phase contrast (gray) images of A. thaliana roots infected with PA14 are shown. Unpublished Image by Cat Foster at Doane University 2014. (B) Confocal microscopy image of Pseudomonas aeruginosa (PA14) biofilm. PA14 growth in vitro two and six hours after inoculation under flow conditions. Viable cells are green (EGFP) and dead cells are red (stained with propidium iodide). Confocal allows for the monitor of x and y plane (central panel) and z axis (bottom and right panel) to characterize biofilm growth. Unpublished Image by Barbara Clement at the Helmholtz Institute for Infectious Disease Research, Susanne Häussler Lab 2014.

