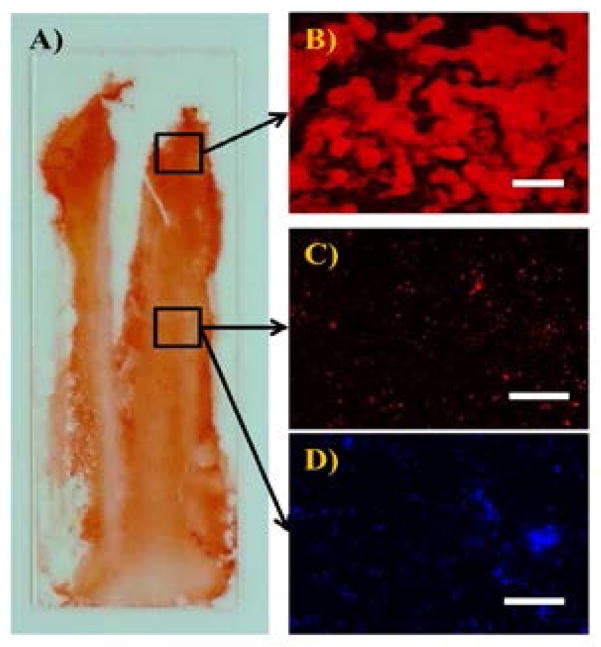
Figure 5.
Images of biofilm stained with tetrazolium salt. Representative images of biofilm growth visualized with insoluble formazan derived from tetrazolium salt, CTC. Growth of biofilm on glass slide (A) has visible to the naked eye biofilm formation after 48 hrs growth in the drip flow biofilm reactor and staining with CTC (red) and DAPI (yellow). The biofilm can further be observed with fluorescent microscopy to qualitatively characterize biofilm shape and quantify area of coverage on glass slide (B) at low magnification and viability quantification with CTC derived fluorescent formazan only staining live cells (C) and DAPI staining all cells (D) at high magnification. Scale Bar C and D=200 μm. Unpublished images obtained by Jasmin Sandoval at Doane University 2016.

