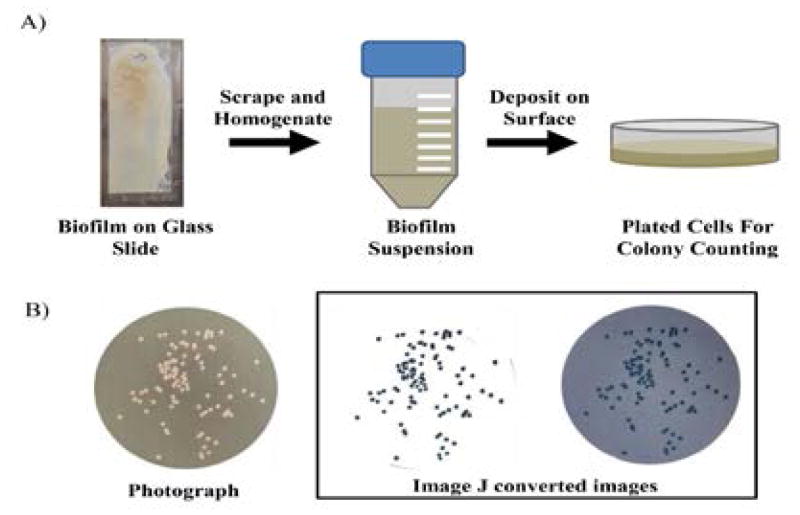
Figure 7.
Image J quantification of bacterial colonies from a biofilm (A) Schematic of biofilm collection from a drip flow reactor on a glass slide suspended in media and plated for colony counting. (B) Photograph of an agar plate with bacterial colonies. The photograph was analyzed with ImageJ so that colonies are black and the background is white in order to achieve maximum contrast between background and colony (left). In this case the program determined that the average size of a single colony was 108.16 pixels. The largest single colony was 135 pixels. If clusters were divided by average size of a colony, 91 colonies were counted. ImageJ was set up so that colonies are black and the background is grey in order to achieve minimal reflectance and uniformity between the background and the colony (right). In this case, if colony clusters were divided by the average size of a colony, 93 colonies were counted.

