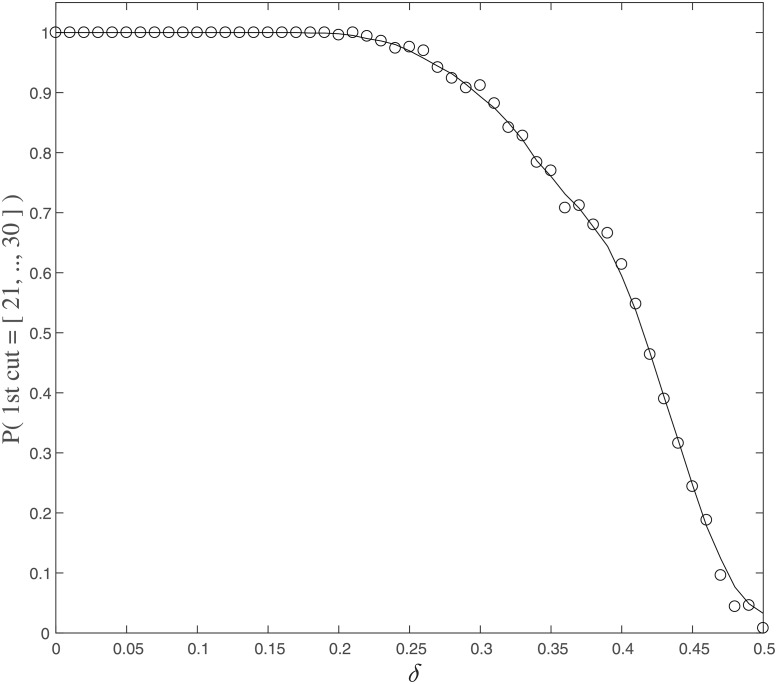
Fig 5. The probability of the subset with the smaller number of elements in the MIP is {21, 22, …, 30} is plotted as a function of the connection parameter δ ∈ [0, 1/2].
Each circle shows the sample probability of 500 independent simulations, and the solid line shows the moving average of the probability.

