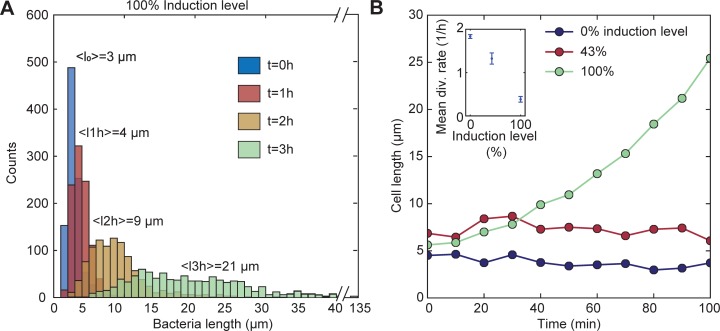
Fig 3. Filamentous bacteria.
(A) Histogram of the cell length (calculated from 1000 cells each) at different time points at 100% induction level (corresponding to 500 μM IPTG and 107 nM aTc). Over time the distribution broadens and the whole population shifts to larger lengths. (B) Tracking the cell length at different induction levels. Inset: division rates decrease with increasing inducer concentrations. Results are mean values over 100 min.

