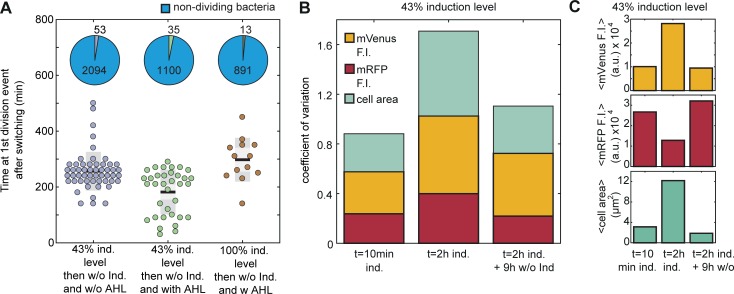
Fig 5. Single cell analysis of cell division switching.
(A) The time delay between the removal of IPTG/aTc with and without AHL at the first cell division event for different inducer concentrations of IPTG/aTc. The pie charts show the fraction of cells that divided compared to the cells that did not divide for each condition. (B) The coefficient of variation was calculated for the fluorescence intensities of mVenus and mRFP and the cell area. The variability of the population increases during the 2 hours induction period and drops again for the new population emerging by switching, i.e., after removal of IPTG/aTc. (C) Upon aTc/IPTG induction, the cells shift towards higher mean mVenus fluorescence intensities, lower mean mRFP and higher mean cell area. After 9 hours without inducers the mean values return to the level of the first measurement (t = 10 min ind.).

