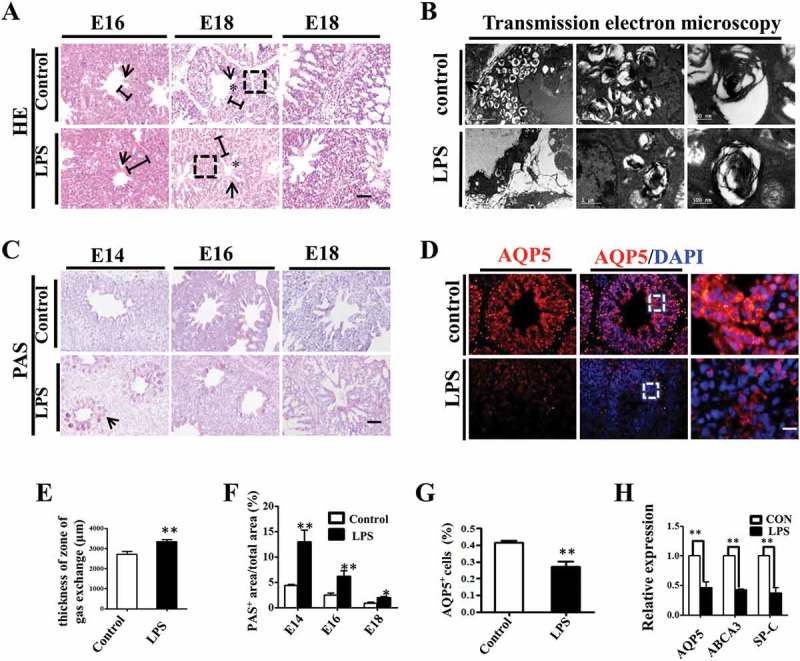
Figure 2.

LPS induced microscopic alteration in chick embryonic lungs. (A, E): H&E staining was performed on transverse sections of chick lungs. The alveolar wall and gas exchange zone are indicated with arrows and line segments, respectively. LPS increased gas exchange zone thickness, and control lungs display a more mature spongy phenotype at E18. (B): The representative TEM images of E18 chick lungs shows lamellar bodies at multiple spherical particles, ranging from 500nm to 5 μm. LPS significantly reduced LB count. (C, F): PAS staining was performed on transverse sections of embryonic chick lungs. LPS induced more PAS+ areas relative to total areas in embryonic chick lungs. (D, G): In immunofluorescent staining of E18 chick lungs, red color shows AQP5 and blue color shows DAPI staining, respectively. The far right panel indicates the dotted squares with higher magnification. LPS significantly reduced AQP5+ cells in E18 chick lungs. (H): qPCR data show LPS significantly induced down-regulation of AQP5, ABCA3 and SP-C expression at mRNA level in E18 lungs. *P < 0.05. **P < 0.01 .Scale bars = 50μm.
