Figure 3.

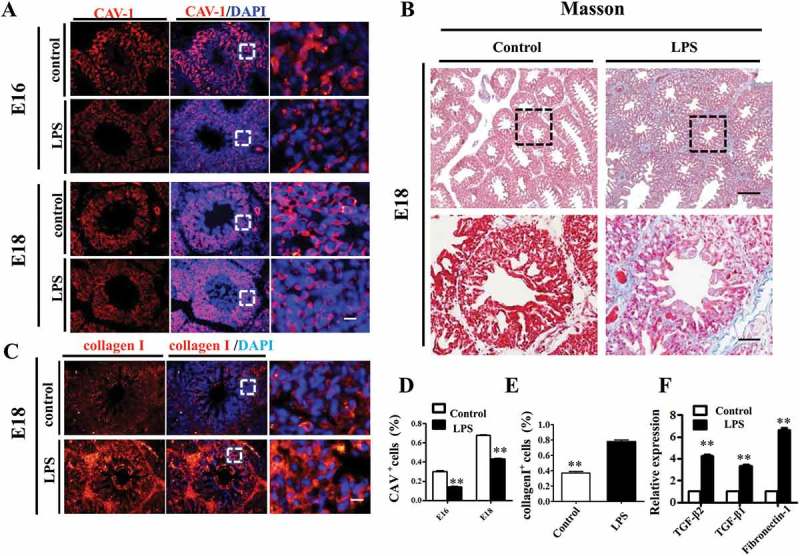
LPS promoted fibrosis in embryonic chick lungs. (A, D): In immunofluorescent staining of chick lungs, red color shows CAV-1 and blue color shows DAPI staining, respectively. The far right panel indicates the dotted squares of the merged images with higher magnification. LPS induced down-regulation of CAV-1 in E16 and E18 chick lungs. (B): LPS increased Masson staining in E18 chick lungs. The lower panel indicates the dotted squares with higher magnification. (C, E): In immunofluorescent staining of E18 chick lungs, red color shows Collagen I and blue color shows DAPI staining, respectively. The far right panel indicates the dotted squares of the merged images with higher magnification. LPS induced more expression of Collagen I in E18 chick lungs. (F): qPCR data show LPS-induced up-regulation of TGF-β2, TGF-β1 and Fibronectin-1 gene expression in E18 chick lungs. *P < 0.05. **P < 0.01. Scale bars = 50 μm.
