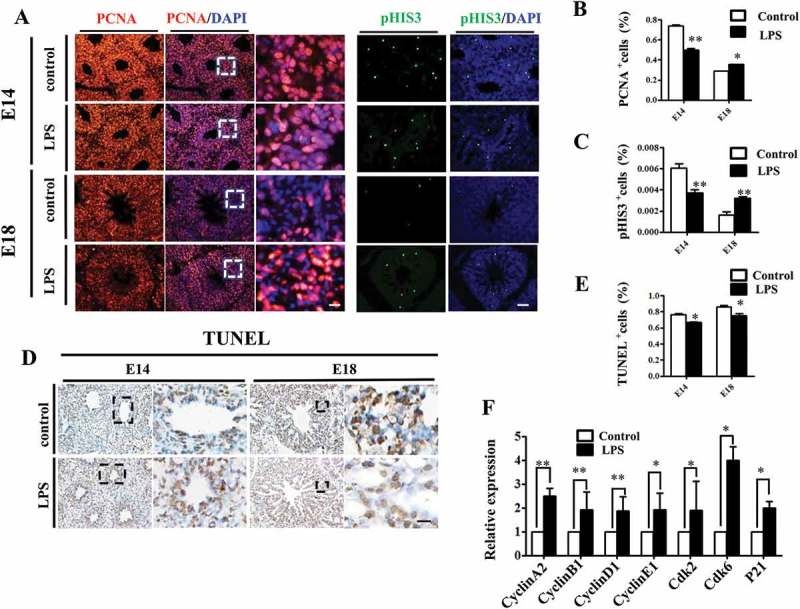
Figure 4.

LPS modulated cell proliferation and apoptosis in embryonic chick lungs. (A, B, C): In immunofluorescent staining of chick lungs, red color shows PCNA, green color shows pHIS3 and blue color shows DAPI staining, respectively. The far right panel indicates the dotted squares of the merged images with higher magnification. Compared to control, PCNA and pHIS3 expression were down-regulated in E14, while up-regulated in E18 chick lungs upon LPS exposure, respectively. (D, E): TUNEL staining of E14 and E18 chick lungs, respectively. The right panels indicate the dotted squares with higher magnification. LPS reduced TUNEL+ cells in E14 and E18 chick lungs, respectively. (F): qPCR data show LPS induced up-regulation of cell cycle related gene expressions in E18 lungs. *P < 0.05. **P < 0.01. Scale bars = 50 μm.
