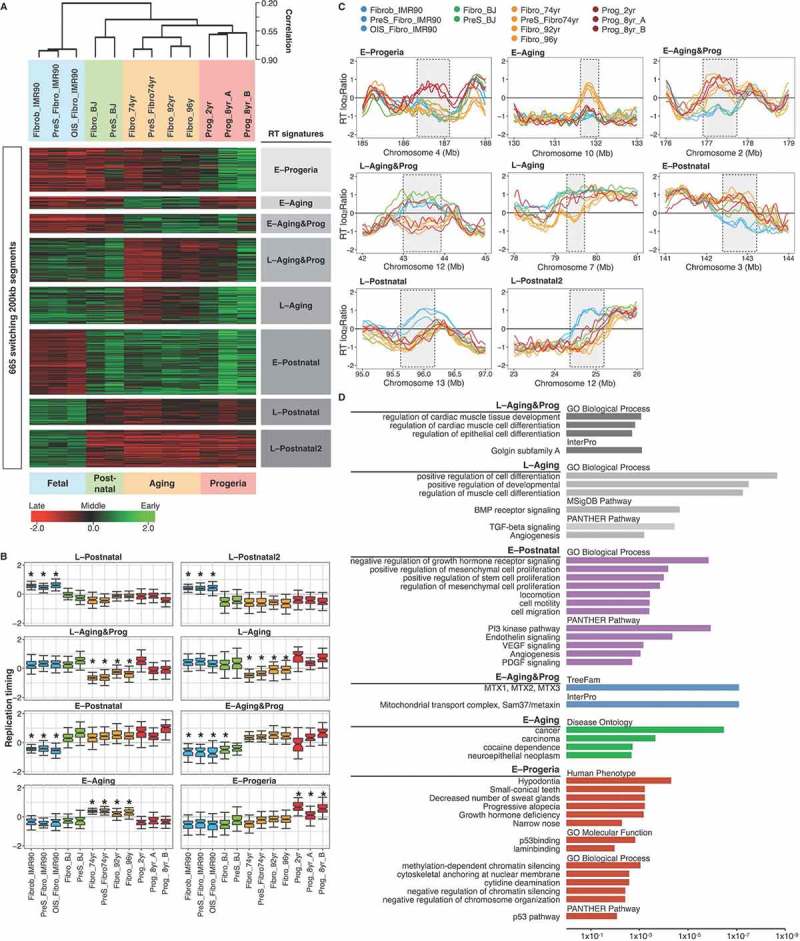
Figure 5.

RT signatures of aging and HGPS. (a) Hierarchical and k-means clustering of RT variable regions between proliferative fibroblasts from distinct age donors (Fibro IMR90, post-natal BJ, 74 yr, 92yr and 96 yr), pre-senescent fibroblasts (preS IMR90, OIS IMR90, pre-senescent BJ, preS 74 yr) and HGPS fibroblasts (Prog_2yr, Prog_8yr_A and Prog_8yr_(b). The heat map shows the RT ratios [= log2(Early/Late)]. Branches of the dendrogram were constructed based on the correlation values between distinct samples (distance = correlation value – 1). k-means clustering of switching segments define RT signatures of segments that were replicated differentially among the samples (labelled in grey boxes). Sex chromosomes were removed from the analysis to discard gender differences. B) RT values of the distinct genomic regions of each RT signature and significant differences are shown (*p-value < 2 x 10⁻¹⁶). (c) RT profiles at representative genomic regions of each RT signature. Significant changes are highlighted by grey boxes. (d) Ontology analysis of the distinct RT signatures. Analysis was performed with the Genomic Regions Enrichment of Annotations Tool [74]. Statistical significance is shown at the bottom (p values measured by binomial test).
