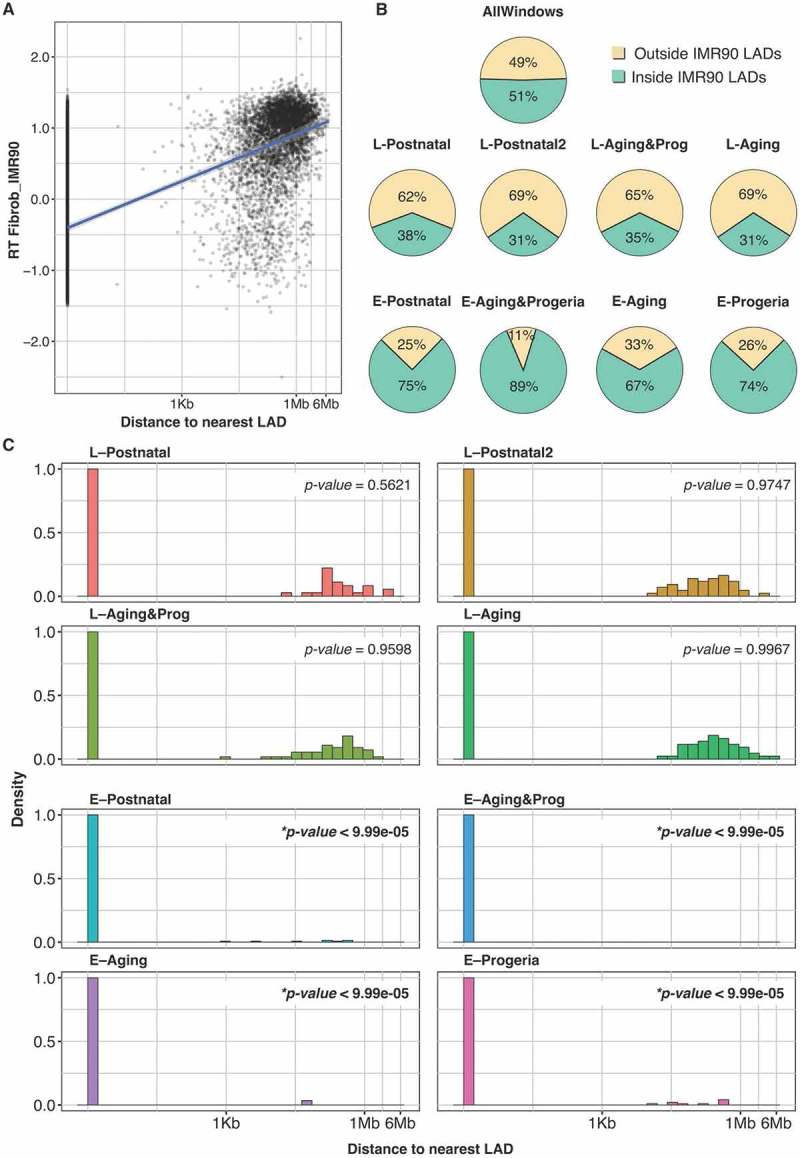
Figure 6.

Early to late RT changes occur at lamin-associated domains (LADs). (a) Scatterplot of RT and distance to IMR90 LADs. (b) Distribution of genomic regions with respect to IMR90 LADs. (c) Histogram of distances to the nearest LADs of regions from distinct RT signatures. The Sequential Monte Carlo multiple testing (MCFDR) algorithm [75] was applied to test whether the regions from each RT signature are closer than expected by chance to the LADs (p-values are shown). IMR90 LADs were obtained from [69].
