
Figure 3.
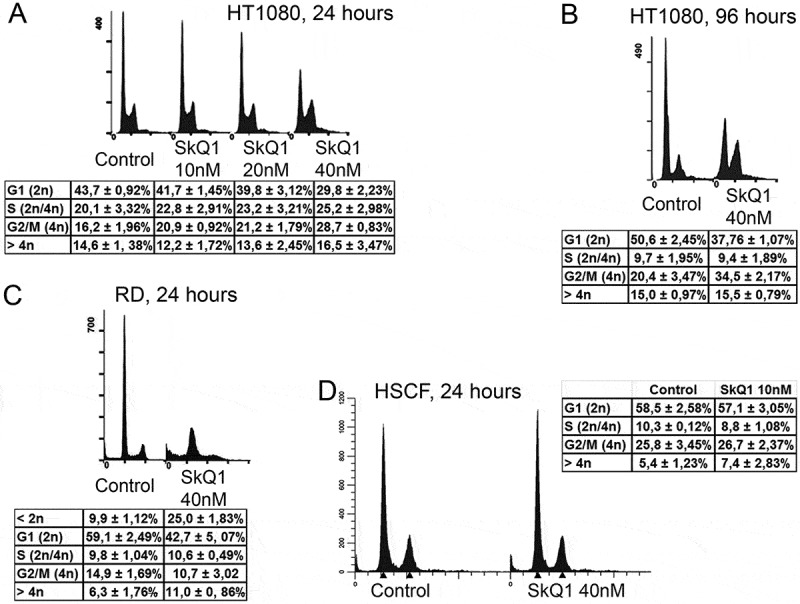
SkQ1 induced cell cycle changes in НТ1080 and RD. A. Cell cycle analysis of the control and SkQ1-treated HT1080 cells (10 nM, 20 nM, 40 nM, 24 hours). Statistically significant difference of data by Student t-test was demonstrated for G1 and G2/M periods after 20 nM (р < 0.05) and 40 nM (р < 0.01) SkQ1 treatment as compared with control. B. Cell cycle analysis of control and SkQ1-treated HT1080 cells (40 nM, 96 hours). Statistically significant difference of data by Student t-test (р < 0.01) was demonstrated for G1 and G2/M periods C. SkQ1 increased apoptotic, < 2n (р < 0.01) and decreased G1 (р < 0.05) cell populations in RD. D. Cell cycle analysis of control and SkQ1-treated (24 hours) HSCF cells. Flow cytometry analysis after staining with propidium iodide. Data are mean ± SEM.