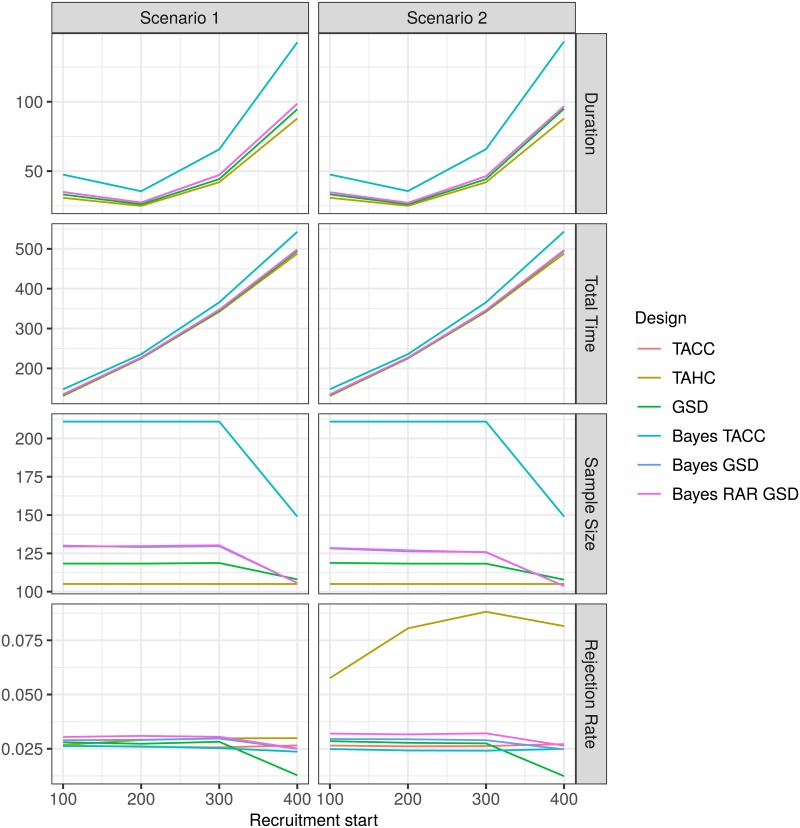
Fig 5. Average duration, average total time to conclusion, average total sample size and rejection rate for each design for the two-arm scenarios 1 and 2 as a function of recruitment start time.
For the historic control design (TAHC) only the average number of patients in the experimental treatment arm is shown.

