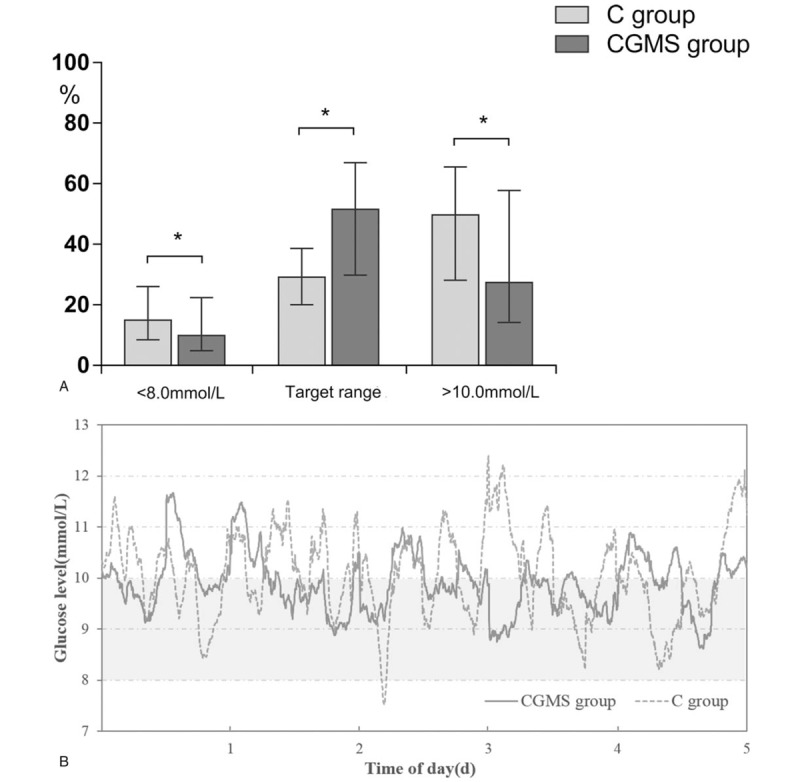
Figure 2.

(A) Time in each blood glucose range for the 5-day study period. Target range: 8.0 to 10.0 mmol L−1. ∗P < .05. Data are presented as median (interquartile range). (B) The overall glucose traces for the 5-day study period. Gray area indicates target range (8.0–10.0 mmol L−1). To convert the values for glucose to millimoles per liter, multiplied by 18. C = conventional point-of-care, CGMS = continuous glucose monitoring system.
