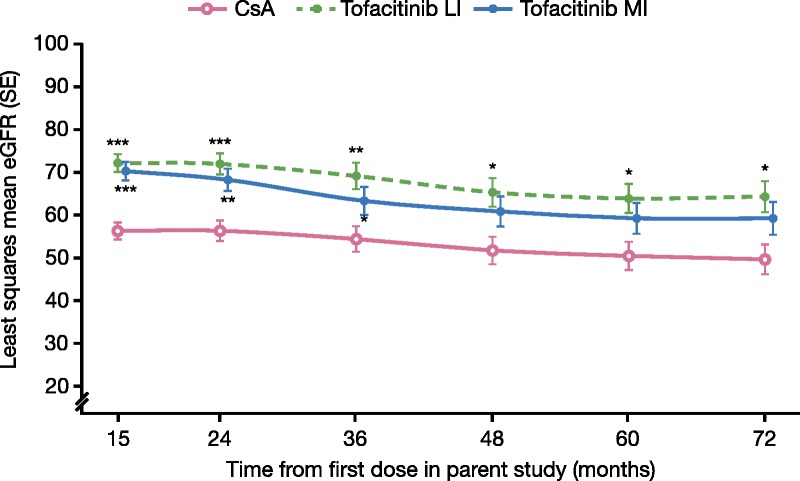
FIGURE 4.

LSM of eGFR (mL/min per 1.73 m2) by MDRD over time, with LOCF plus imputation of death and graft loss as zero eGFR. ***P < 0.0001; **P < 0.001; *P < 0.05 for tofacitinib versus CsA. P value from linear mixed model with treatment, visit, and treatment by visit interaction as fixed effects. An unstructured variance-covariance was used. These data represent LSM eGFR by MDRD equation with LOCF plus imputation (patients with death or graft loss were imputed as eGFR = 0) over time and corresponding SE. Data presented are from the LTE study (A3921050; NCT00658359), months 12 to 72.
