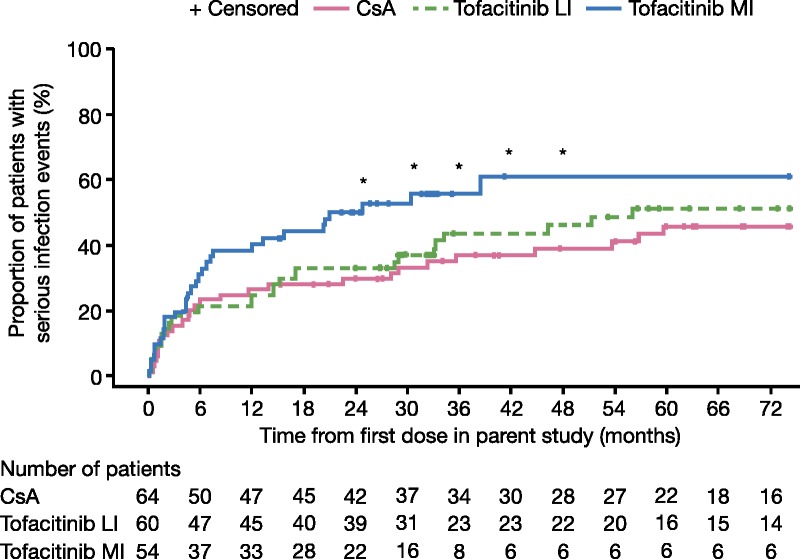
FIGURE 5.

KM estimates of serious infection events in the study period. *P < 0.05 for comparison of CsA and tofacitinib MI; Wald test comparing rate differences. Data represent KM estimates of serious infection events over the full analysis set for the parent study (A3921030; NCT00483756), months 0 to 12, and the LTE study (A3921050; NCT00658359), months 12 to 72.
