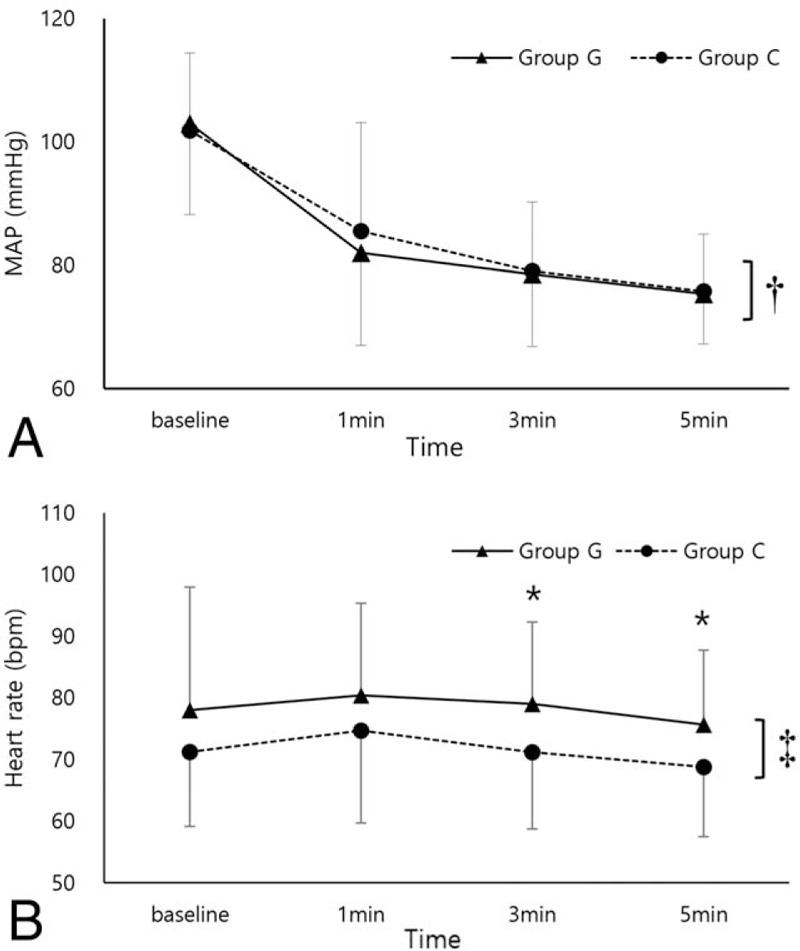
Figure 2.

(A) MAP before induction of anesthesia (baseline) and 1, 3, and 5 minutes after intubation (mean [SD]). (B) HR before induction of anesthesia (baseline) and 1, 3, and 5 minutes after intubation (mean [SD]). ANOVA = analysis of variance, Group C = control group, group G = glycopyrrolate group, HR = heart rate, MAP = mean arterial pressure, SD = standard deviation. ∗P < .05; values were compared using the Student t test. †P = .95; compared using the between-subjects effects test of a repeated-measures ANOVA. ‡P = .03; compared using the between-subjects effects test of a repeated-measures ANOVA.
