
Figure 4. A nonmetric multidimensional scaling plot of the bacterial community within healthy and diseased tissue homogenates after Illumina sequencing of the 16S rRNA gene.
Grey dots represent the healthy homogenate samples and the black dots represent the disease homogenate samples. NB denotes the samples that came from corals in August 2015, when they were not bleached. B denotes the samples that came from corals in September 2015, when corals were bleached. Note that two healthy points were so similar in multidimensional space that they overlap within the present figure.
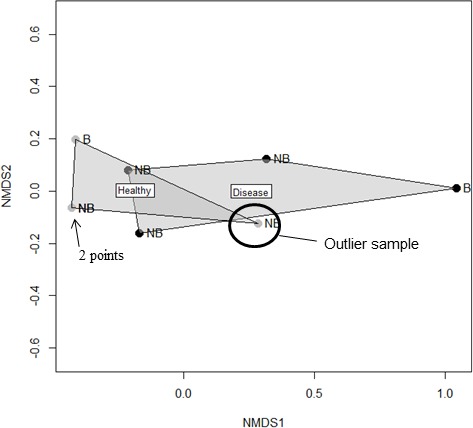
Figure 4—figure supplement 1. Histogram showing the average relative abundance of each major bacterial class identified within the healthy and disease tissue homogenates, excluding the one outlier sample.

Classes grouped within ‘Others’ are those with a < 3% relative abundance within the homogenates.