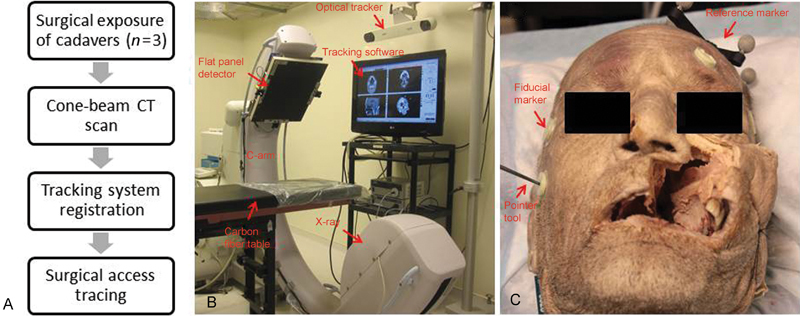
Fig. 1.

Illustration of the study work flow. (A) Flow chart of experimental protocol showing an overview of study design. (B) Experimental setup with cone-beam computed tomography (CT) and optical tracker. (C) Representative cadaver specimen on the carbon fiber table with fiducial markers on its surface and reference marker tracked by the optical tracker.
