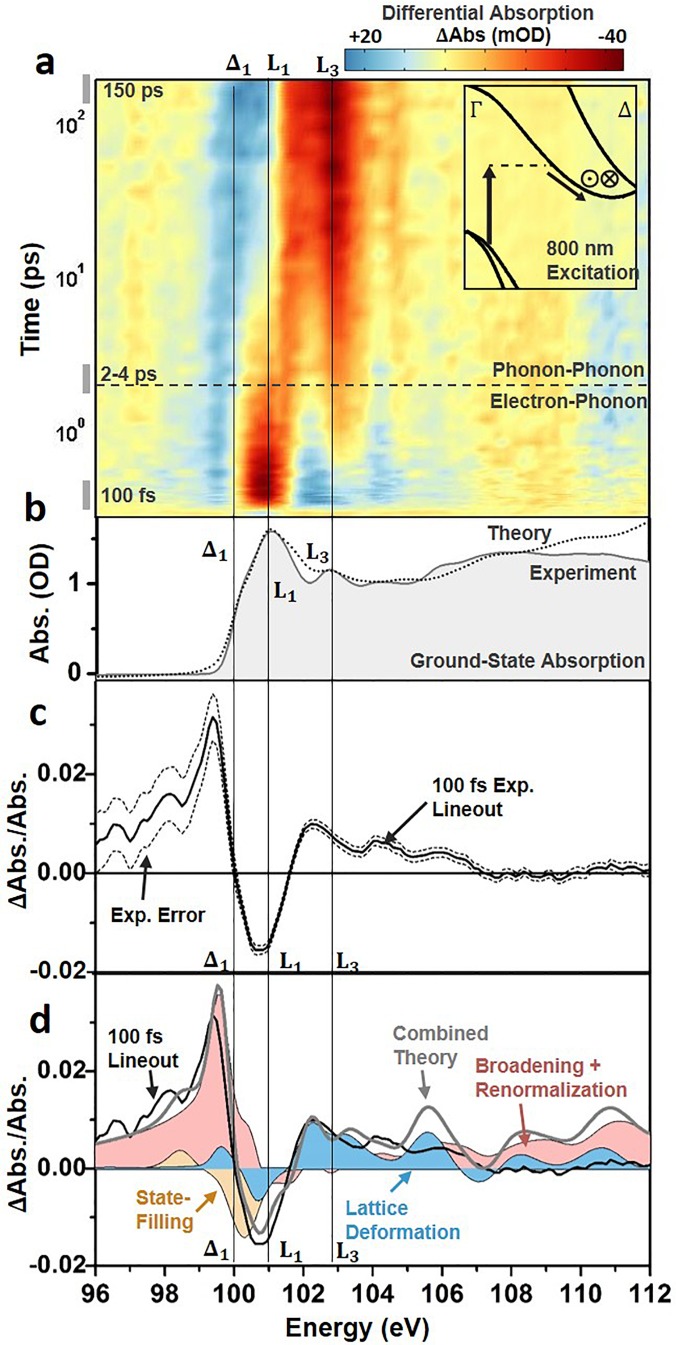
FIG. 2.
Differential absorption data following 800 nm excitation of the Si L23 XUV edge. (a) The differential absorption data are shown as a color map on a logarithmic time scale up to 200 ps time delay following 800 nm excitation to the Δ1 valley. The inset shows the excitation and scattering pathways for the excited electrons. The in and out of plane arrows indicate where inter-valley scattering between degenerate valleys is possible. The cross-over time between predominantly electron-phonon scattering or phonon-phonon scattering is also indicated by the dashed horizontal line. (b) The static ground state experimental and theoretical absorption from Fig. 1(b) are shown for comparison to the differential absorption. (c) The experimental 100 fs differential absorption (black solid line). The dashed lines indicate the 95% confidence intervals of the measurement. (d) The theoretically predicted state-filling (light orange), broadening and renormalization (light pink), and lattice deformation (light blue) contributions for a 1.5 × 10²⁰/cm3 photoexcited carrier density The grey solid line indicates the combined theoretical contributions of the shaded areas.

