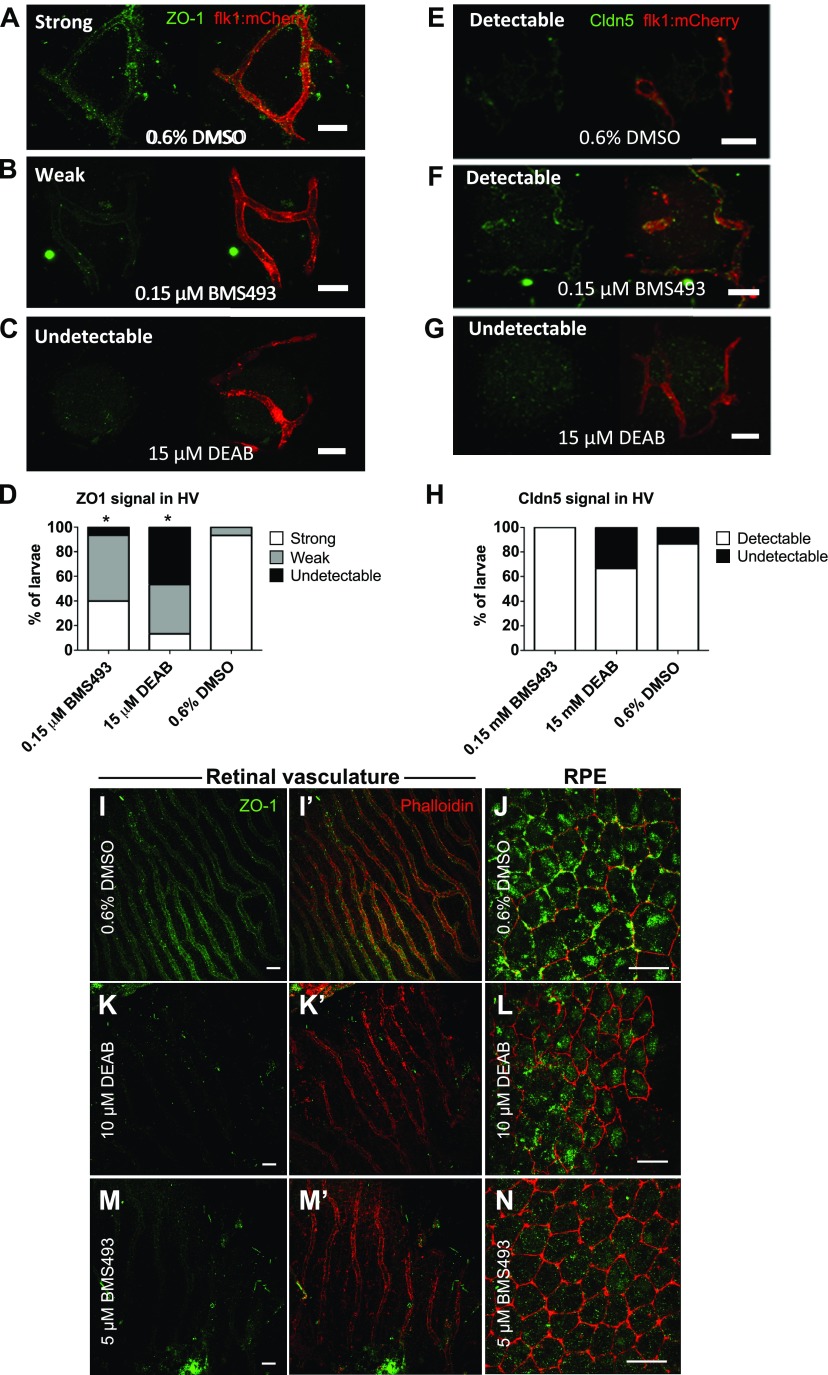
Figure 5.
ZO1 expression is disrupted in the hyaloid vasculature of larvae treated with DEAB and BMS493. A–C) Confocal micrographs of 7 dpf Tg(flk1:mCherry) zebrafish vasculature (red) labeled with anti-Cldn5 or anti–ZO-1 (green). In fish treated with DMSO alone (A) anti–ZO-1 labeling was robust, whereas in BMS493-treated larvae (B) anti–ZO-1 labeling was weaker and in DEAB-treated larvae (C). ZO-1 was largely undetectable. Scale bars, 20 µm. D) Graph depicting the percentage of fish from each treatment group with strong, weak, or undetectable anti–ZO-1 labeling (n = 15 fish/treatment) P < 0.005 (χ2 test). E–G) Anti-Cldn5 labeling was detected throughout the hyaloid vasculature in fish treated with DMSO (E) or BMS493 (F) and in most fish treated with DEAB (G), Scale bars, 20 µm. H) Graph depicting the percentage of fish from each treatment group with detectable or undetectable anti-Cldn5 labeling (n = 15 fish/treatment). P = not significant. I–N) Confocal micrographs of the retinal vasculature and RPE of adult zebrafish treated with 0.6% DMSO, 10 µM DEAB, or 5 µM BMS493 for 48 h. ZO-1 antibody (green) labels the cellular junctions (labeled in red by fluorescent-coupled phalloidin) in the retinal vessels (I, I′) and RPE (J) of DMSO-treated control fish. Scale bars, 20 µm. K, L) In fish treated with DEAB, ZO-1 expression is disrupted in the retinal vessels (K, K′) and RPE (L). ZO-1 expression is also disrupted in the retinal vessels (M, M′) and RPE (N) of fish treated with BMS493. Scale bars, 10 µm.

