Figure 11.
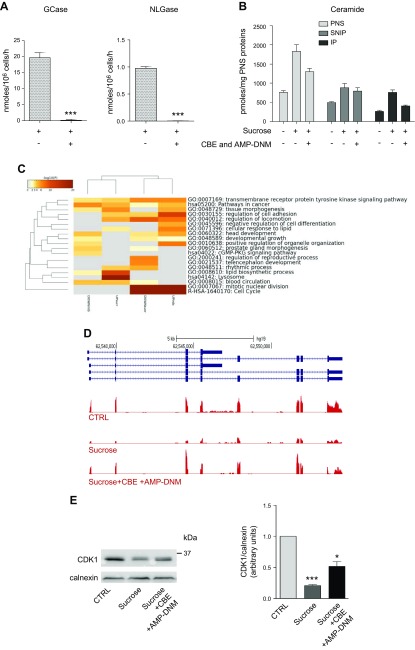
Cell growth arrest is rescued by the inhibition of glycosphingolipid catabolism on the PM. A) PM-associated activities of GCase and NLGase in sucrose-loaded cells treated or untreated with GCase and NLGase inhibitors (CBE and AMP-DNM, respectively). Activities were normalized to nmol/106 cells/h ± sd. ***P < 0.0005 vs. sucrose (n = 3). B) Graph representing the picomoles of ceramide associated with the fraction obtained by streptavidin separation after cell-surface biotinylation from PNS preparation in conditions that preserved the lipid–protein interactions. Bars refer to control, sucrose-loaded cells, and sucrose-loaded cells treated with inhibitors. *P < 0.04 vs. ctrl, **P < 0.006 vs. ctrl, #P < 0.03 vs. sucrose, ##P < 0.009 vs. sucrose (n = 2). Data are expressed as pmol/mg PNS protein. C) Comparison of GO enrichment analysis among DE genes in sucrose-loaded cells untreated or treated with GCase and NLGase inhibitors after 14 d. The heatmap reports P values for significance of enrichment; gray cells indicate a lack of enrichment. D) Snapshot of RNAseq expression data for the CDK1 gene, showing down-regulated and enhanced mRNA levels, respectively, in fibroblasts treated with sucrose alone or with sucrose and GCase and NLGase inhibitors (CBE + AMP-DNM). E) Immunostaining of CDK1 evaluated in control (ctrl), 14-d sucrose-loaded cells (sucrose), and 14-d sucrose-loaded cells treated with GCase and NLGase inhibitors (sucrose + CBE + AMP-DNM); calnexin was used as the loading ctrl (left). A semiquantitative graph of normalized CDK1/calnexin (right). ***P < 0.0001 vs. ctrl, *P < 0.02 vs. sucrose (n = 3).

