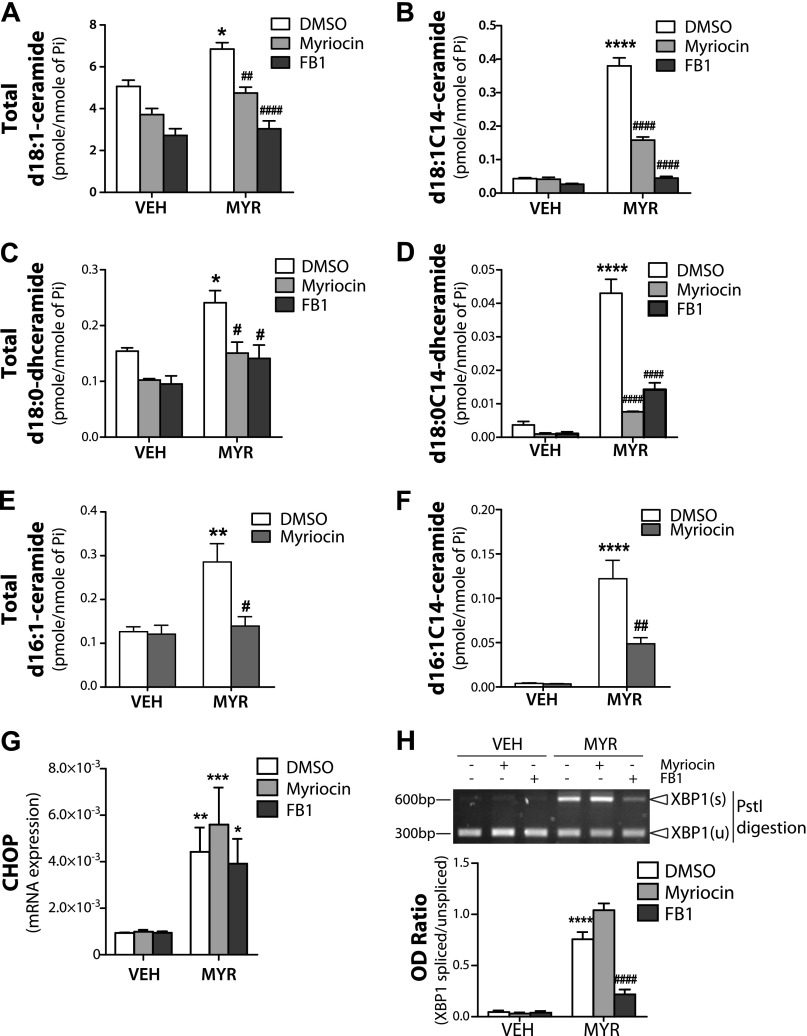
Figure 3.
CerS inhibition suppresses myristate-induced C14:0-ceramide generation and XBP1s. IEC6 cells were pretreated with 100 nM myriocin (Myr; SPT inhibitor) or 50 mM FB1 (CerS inhibitor) for 1 h, then treated with 0.6 mM MYR or vehicle (Veh) for 16 h. A–F) Total d18:1-ceramide (A) and d18:1C14-ceramide (B), total d18:0-dihydroceramide (C), d18:0C14-dihydroceramide (D), total d16:1-ceramide (E), and d16:1C14-ceramide (F) levels were determined by electrospray ionization tandem mass spectrometry in the Stony Brook University Lipidomics Shared Resource Core and normalized to total lipid phosphate (Pi). G) mRNA levels of CHOP were analyzed by quantitative RT-PCR and normalized to β-actin. H) XBP1s was analyzed using RT-PCR and PstI digestion (upper panel) and quantified as OD ratio using ImageJ (lower panel). Data represent means ± sem, n = 3. *P < 0.05, **P < 0.01, ***P < 0.001, ****P < 0.0001 compared with Veh; #P < 0.05, ##P < 0.01, ####P < 0.0001 compared with DMSO Myr treatment.

