
Figure 1 |. Mapping the T2I inflamed human sinus cellular ecosystem by scRNA-seq.
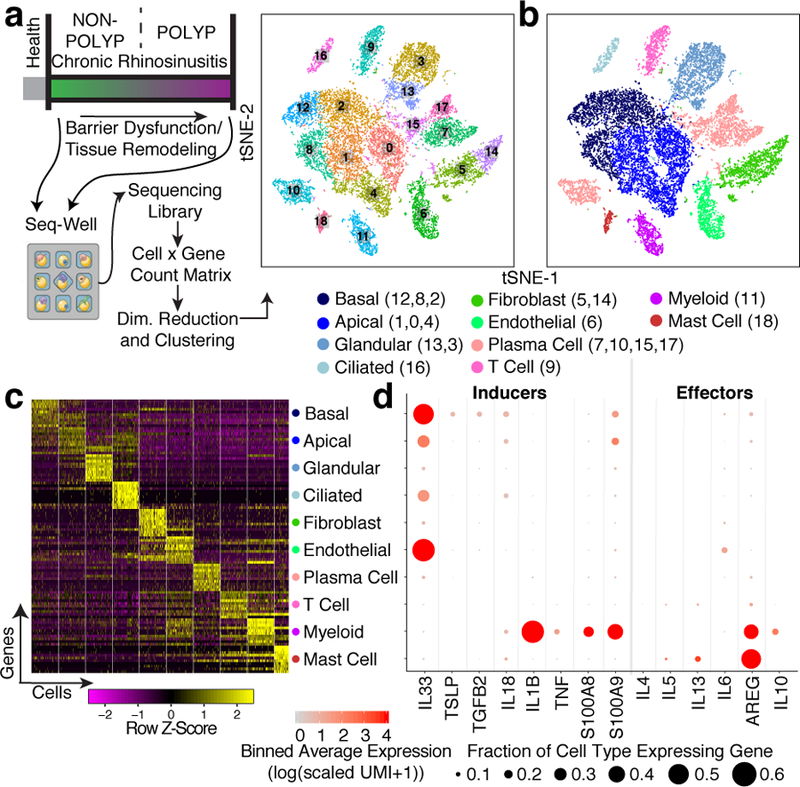
a, Clinical disease spectrum (n=12 samples) and experimental workflow leading to a tSNE plot displaying 18,036 single cells, colored by shared nearest neighbor (SNN) clusters and (b) cell types (ROC-test; Supplementary Table 3; Methods) from respiratory tissue. c, Heatmap of top-10 marker genes by ROC-test (AUC>0.73) for indicated cell types; maximum 500 cells/type (Extended Data Fig. 2a annotated; Supplementary Table 3 full gene list). d, Dot plot of T2I mediators mapped onto cell types across all samples (Extended Data Fig. 4 by disease state).