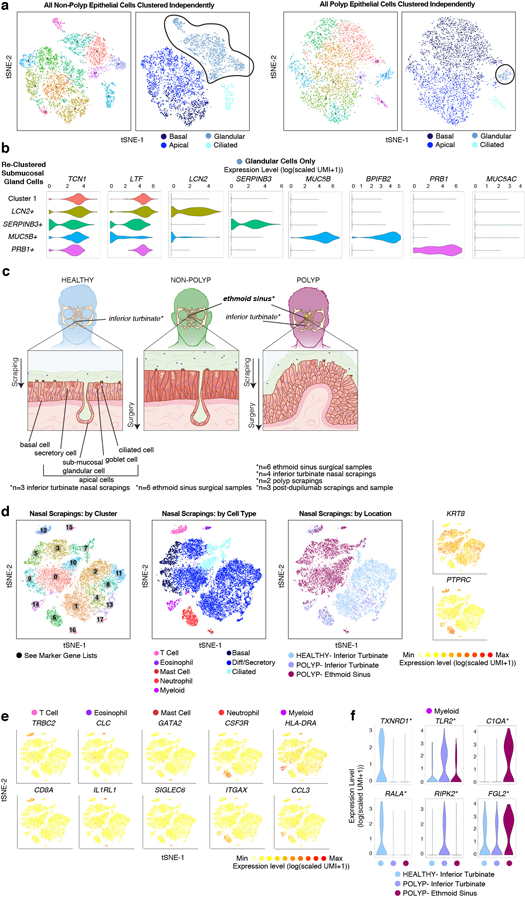
Extended Data Figure 6 |. Glandular cell subsets, their relationship to apical secretory cells, and immune cells recovered through nasal scrapings.

(a) tSNE plots of 5,928 single epithelial cells (n=6 non-polyp samples), and 4,346 single epithelial cells (n=6 polyp samples) colored by clusters identified through (left) shared nearest neighbor (SNN) analysis and (right) original biological curation of cell types (Supplementary Table 3; Methods) as illustrated in Figure 2a. NB: cluster colors in left panels of each disease are not comparable but curated clusters in right are, and glandular cells are highlighted for subsetting in next panel.
(b) Violin plots for the count-based expression level (log(scaled UMI+1)) of selected marker genes identified through marker discovery (ROC test) for each subset of glandular cells; 2,114 total cells (791 cells cluster 1; 709 cells LCN2 cluster; 283 cells SERPINB3 cluster; 209 cells MUC5B cluster; 183 cells PRB1 cluster) with representation of every non-polyp patient in each cluster of cells (e.g. no cluster is unique to one patient) and AUC metric 0.800 for LCN2, 0.736 for SERPINB3, 0.985 for MUC5B, 0.973 for BPIFB2, and 0.908 for PRB1.
(c) Samples were acquired through the two distinct methods of nasal scraping and ethmoid sinus surgical intervention. This allowed for sampling of left: healthy tissue from InfTurb (scraping), middle: of CRS-EthSin-non-polyp tissue (surgery), right: of CRS-EthSin-polyp tissue (surgery), of InfTurb of polyp-bearing individuals (scraping), and of CRS-EthSin-polyp tissue accessible for scraping (scraping). Anatomy of the nasal turbinates (healthy and CRS polyp) and ethmoid sinus (CRS non-polyp and CRS polyp) where samples were acquired is displayed below, highlighting the depth of cells recovered from each site related to Fig. 2. Healthy tissue is annotated with basal and apical cell types, including sub-mucosal glands.
(d) Left: tSNE plot of 18,704 single cells from nasal scrapings (n=9 samples) colored by clusters identified through shared nearest neighbor (SNN) analysis (Supplementary Table 3; Methods); middle: tSNE plot colored by cell types identified through marker discovery (ROC test) and biological curation of identified clusters (Supplementary Table 3; Methods); right: colored by disease and tissue of origin from healthy InfTurb (7,603 cells; n=3 samples), polyp-bearing patient InfTurb (2,298 cells; n=4 samples), and polyp scraping directly from EthSin-polyp (8,803 cells; n=2 samples); with adjacent select marker gene overlays displaying count-based UMI-collapsed expression level (log(scaled UMI+1)) for apical epithelial (KRT8) and hematopoietic (PTPRC) genes.
(e) Select marker gene overlays displaying count-based UMI-collapsed expression level (log(scaled UMI+1)) on a tSNE plot from (a) for key cell types identified (see Supplementary Table 3 for full gene lists); area under the curve (AUC) 0.946 to 0.705 for all markers displayed.
(f) Violin plots for the count-based expression level (log(scaled UMI+1)) for key differentially expressed genes using ROC test within myeloid cells across disease states and tissues identified (Methods); 137 cells, n=3 healthy inferior turbinate; 157 cells, n=4 polyp inferior turbinate; 210 cells, n=2 polyp ethmoid sinus samples; AUC 0.67 for TXNRD1, 0.615 for RALA, 0.647 for TLR2, 0.619 for RIPK2, 0.747 for C1QA, 0.674 for FGL2.
