
Extended Data Figure 4 |. Mapping T2I mediators within EthSin non-polyp or polyp ecosystems and the identities of T cells.
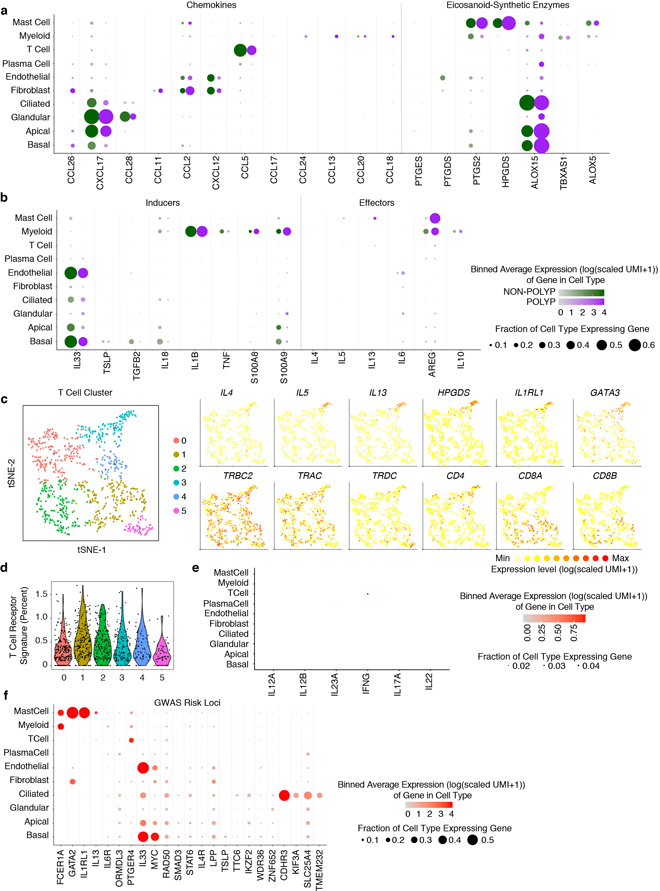
(a) Dot plots of chemokines and lipid mediators with known roles in T2I mapped onto cell types divided by non-polyp or polyp disease state. Dot size represents fraction of cells within that type expressing, and color intensity binned (log(scaled UMI+1)) gene expression amongst expressing cells (related to Figure 1d).
(b) Dot plot of inducers and effectors of T2I mapped onto cell types divided by non-polyp or polyp disease state. Dot size represents fraction of cells within that type expressing, and color intensity binned (log(scaled UMI+1)) gene expression amongst expressing cells (related to Figure 1d).
(c) tSNE plot of re-clustered T cells with select gene overlays displaying binned count-based expression level (log(scaled UMI+1)) for Th2A-specific genes (top row) and canonical T cell markers (bottom row); 835 T cells from n=6 non-polyp and n=6 polyp samples.
(d) Violin plot of five identified T cell clusters scored for expression of T cell receptor complex genes (e.g. TRAC and CD3E, see Methods, Supplementary Table 4); dots represent individual cells, 835 total T cells.
(e) Dot plot of inducers and effectors of Type 1 immunity across all cell types (NB: IL17F not detected).
(f) Dot plot of select GWAS risk alleles41 for allergic disease, mapped onto cell types divided by non-polyp or polyp disease state. Dot size represents fraction of cells within that type expressing, and color intensity binned (log(scaled UMI+1)) gene expression amongst expressing cells (related to Figure 1d).