Fig. 2.


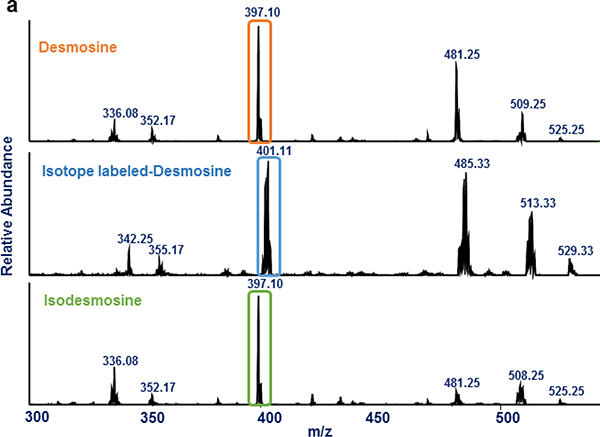
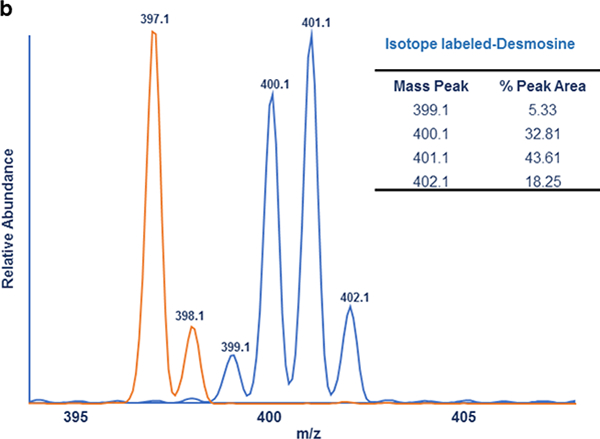
MALDI-MS2 analysis of Des, Isodes and Labeled-Des- (a) MS2 spectra of Des, Labeled-Des and Isodes are shown in a top, middle and bottom panel respectively. The highlighted fragment ions resulted from loss of a side chain of Des and Isodes (m/z 397) and Labeled-Des (m/z 401) were used for the quantification of Des/Isodes. (b) Isotope distribution of the fragment ion (m/z 401) of Labeled-Des and the fragment ion (m/z 397) of Des/Isodes are shown in blue and orange respectively. The result shows two major isotope peaks, m/z 400 and 401, represent greater than 75 percentage of total peak area of the fragment ion (m/z 401)
