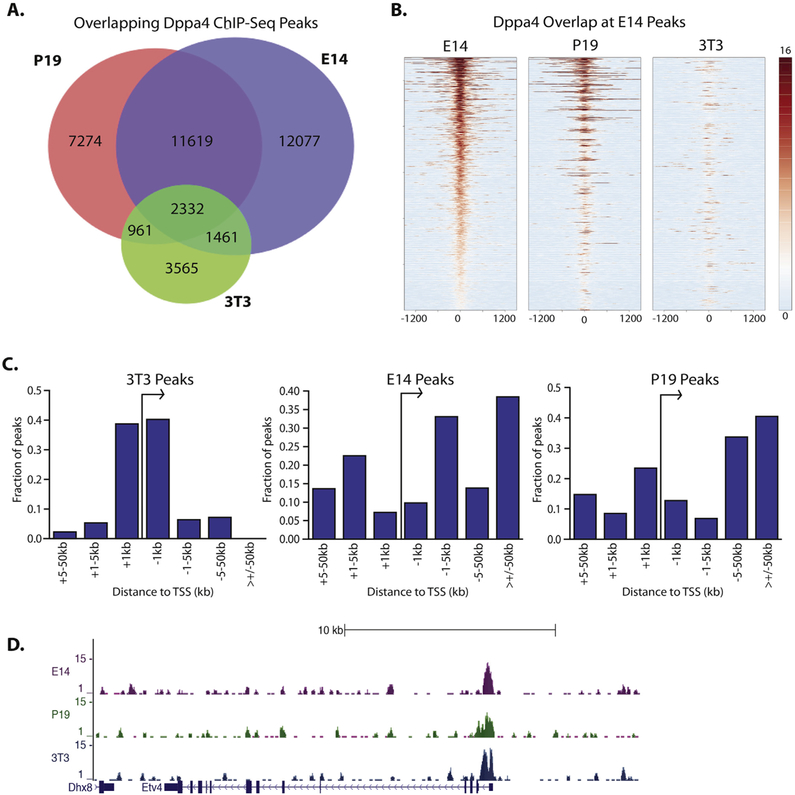
Fig. 1.
Patterns of Dppa4 binding in E14 mESC, Dppa4 overexpressing 3T3 fibroblasts, and P19 embryonal carcinoma cells. A) Overlap of Dppa4 peaks between 3T3, P19, and E14 cells. B) Heatmap plot of E14, P19, and 3T3 ChIP-Seq reads centered on E14 Dppa4 peaks. C) Comparison of genomic distribution of Dppa4 peaks in E14, P19, and 3T3 cells. D) Dppa4 ChIP-Seq peaks at the Etv4 promoter.

