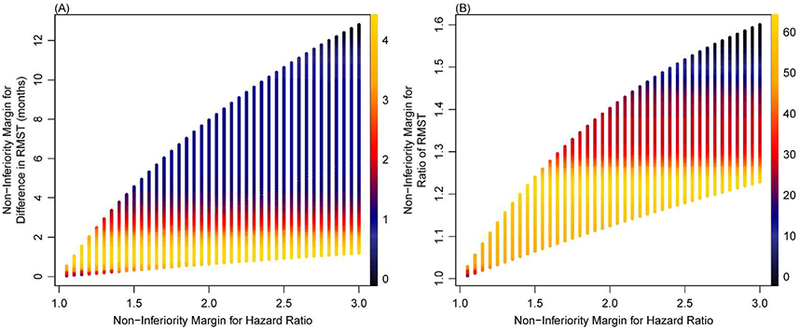
Figure 2.

Density plots for margin equivalence across 3,358 Weibull distributions.
Each point corresponds to one of 3,358 unique Weibull distributions evaluated at up to 3 time horizons across the range of hazard ratio margins from 1.05 to 3.00, totaling 317,720 unique combinations. We describe the Weibull distribution parameters and time horizons in Appendix Figure 4.
