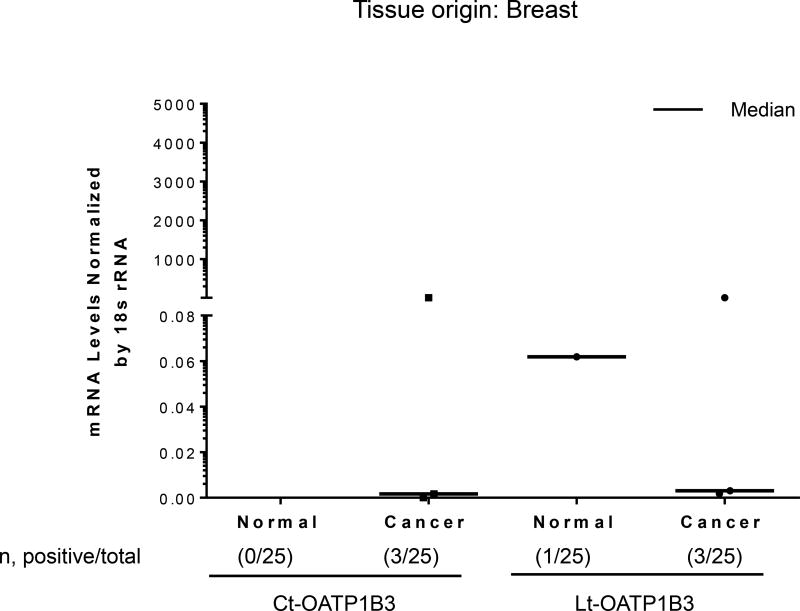
Figure 4. Expression profiles of Ct- and Lt-OATP1B3 mRNA in patients with breast cancer.
Ct- and Lt-OATP1B3 mRNA levels in normal and cancerous breast tissues. The number of samples with positive expression over the total number of clinical samples in each group is shown in parentheses. The median value in mRNA expression level for each group is shown as a solid horizontal line.

