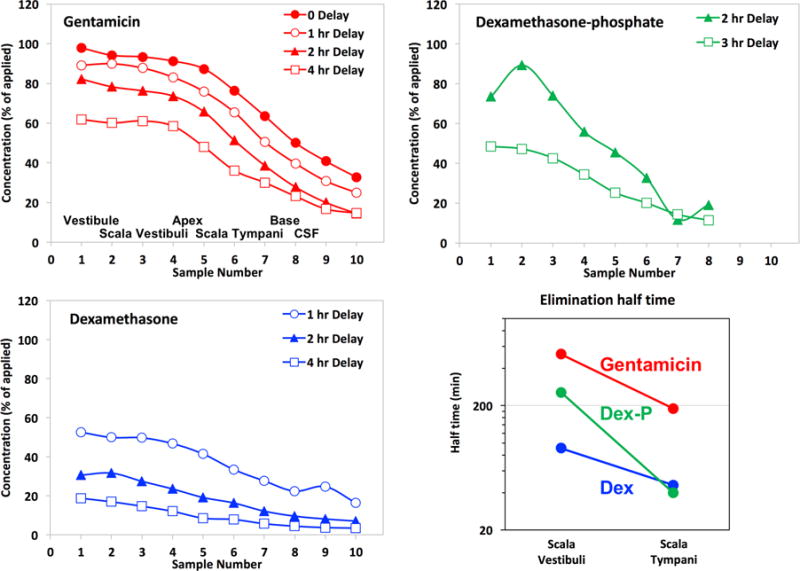
Figure 5.

Perilymph elimination compared by perilymph loading followed by sequential sampling from the LSCC after the delay times indicated. The approximate origins of the samples are indicated in the first panel. These curves show the progressive decline of perilymph drug concentration with time. Dexamethasone and dexamethasone-phosphate data are from Salt et al., (2012b) and gentamicin data are from Salt et al., (2016).
