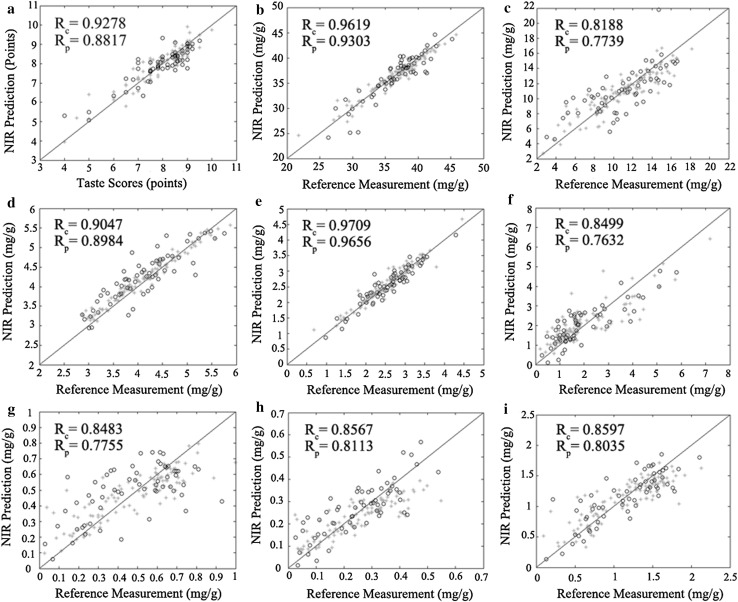
Fig. 1.
Scatters plots of each BP-AdaBoost model showing the correlation between reference measurement and NIR prediction in calibration set (*) and the prediction set (o): a taste score model, b water extracts model, c tea polyphenol model, and d free amino acids model, e caffeine model, f total catechins model, g TF2A model, h TF2B model, i theaflavins model

