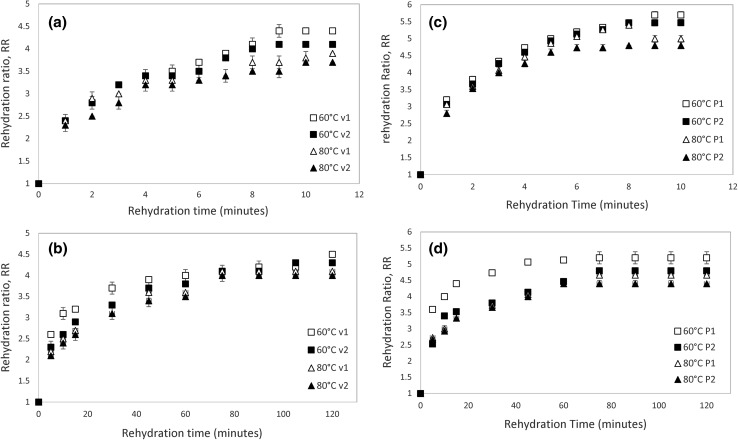
Fig. 3.
Weight gain on rehydration as a function of the rehydration temperature and time for both drying methods. a Rehydration curve at 100 °C for hot-air dried samples. b Rehydration curve at 30 °C for hot-air dried samples. c Rehydration curve at 100 °C for vacuum dried samples. d Rehydration curve at 30 °C for vacuum dried samples (v1 = 0.2 m/s; v2 = 0.7 m/s; P1 = 25 mmHg absolute; P2 = 50 mmHg absolute)

