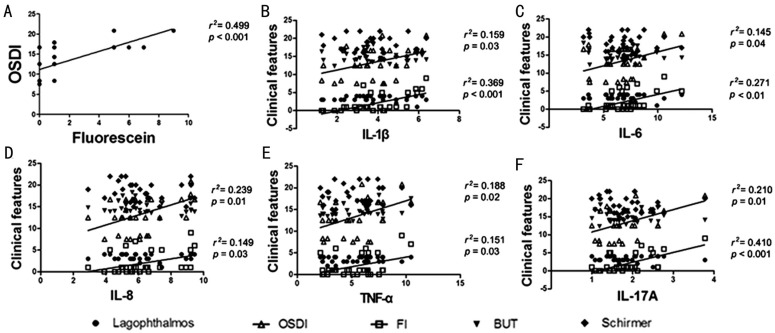
Figure 3. The graph showing the correlation between inflammatory cytokines and clinical features.
A: The OSDI score was significantly correlated to the Fl score; B: The levels of IL-1β were significantly correlated to OSDI score and Fl score; C: The levels of IL-6 were significantly correlated to OSDI score and Fl score; D: The levels of IL-8 were significantly correlated to OSDI score and Fl score; E: The levels of TNF-α were significantly correlated to OSDI score and Fl score; F: The levels of IL-17A were significantly correlated to OSDI score and Fl score.

