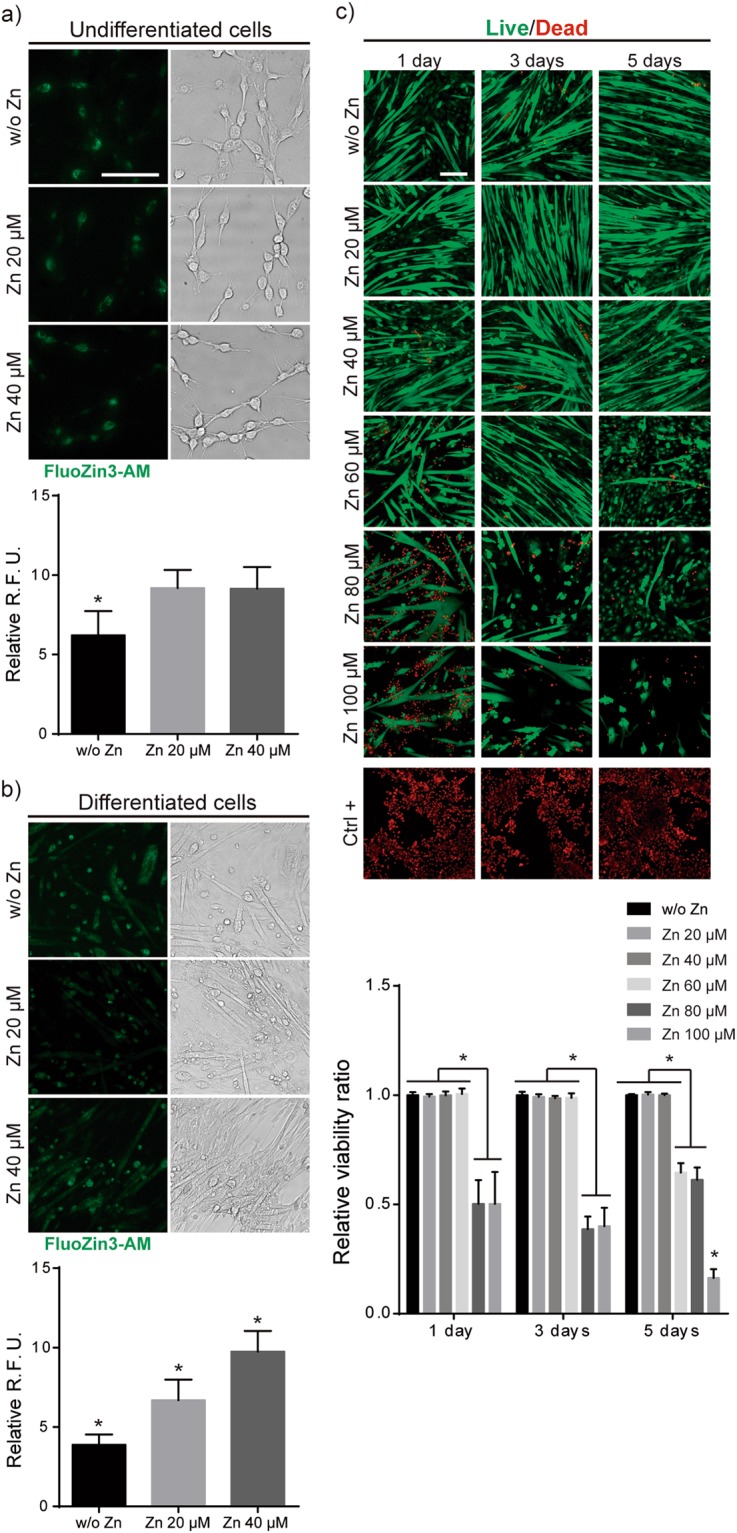
Figure 3.

Quantification of intracellular Zn2+. (a) Bright field and fluorescence images of intracellular Zn2+ in undifferentiated (1 day of culture) C2C12 after Fluozin3-AM labelling. (b) Bright field and fluorescence images of intracellular Zn2+ in differentiated C2C12 (6 day of culture, myotubes) after Fluozin3-AM labelling. Values are represented as relative fluorescent units (R.F.U.) for intracellular zinc. (c) Live/Dead images of myotubes (differentiated cells) and quantification represented as viable cells ratio (number of viable cells +Zn/number of viable cells w/o Zn). (Scale bar: 200 μM). (N = 7 independent experiments performed). Graphs show mean ± standard deviation. Significant differences were determined by ANOVA test; *p < 0.05.
