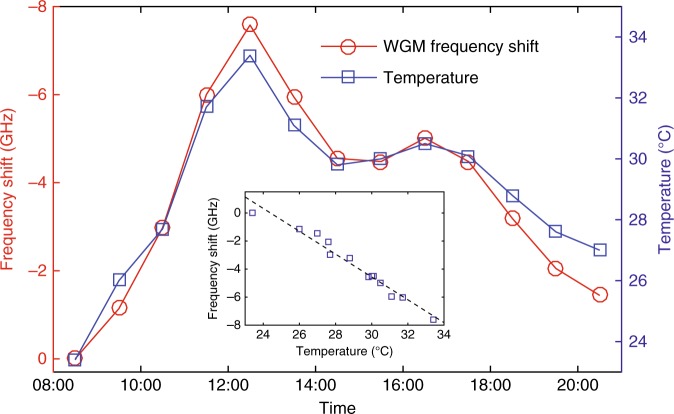
Fig. 3. Air temperature measurement.
The wireless sensing system was deployed outdoors to monitor the variation of the air temperature from 8:30 AM to 8:30 PM on June 18th, 2017 in St. Louis, MO, USA. The red circles denote the frequency shift of the selected resonance mode versus time, and the blue squares are the measurements of the temperature change by a commercial thermometer. The inset shows a linear dependence of the resonance frequency shift on the temperature change, where the blue squares denote experimental measurements and the black dashed curve is a linear fit of the experimental results

