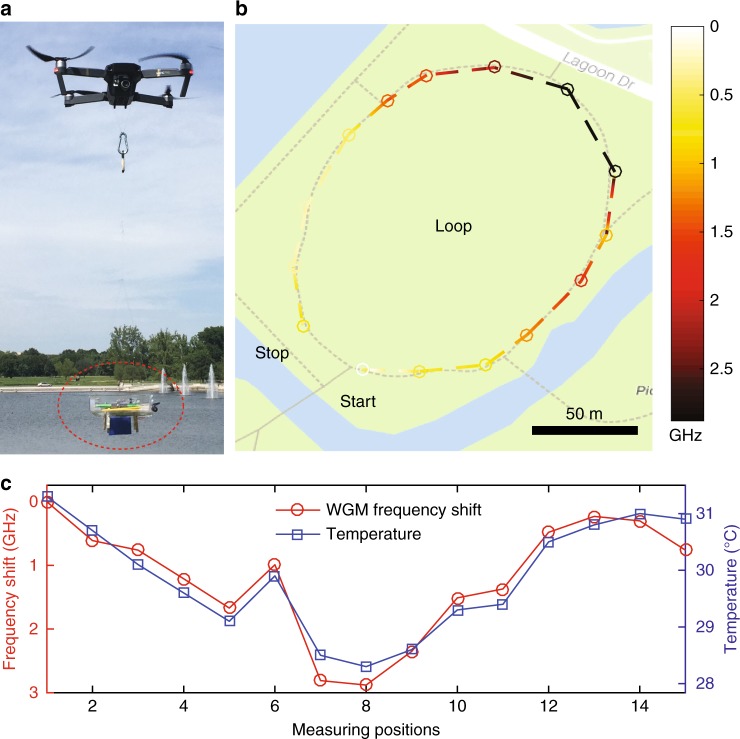
Fig. 4. Aerial mapping of the temperature distribution.
An unmanned drone was used to carry the wireless sensing system to measure the temperature distribution of a selected area in a city park of St. Louis. A commercial thermometer with a bluetooth connection was mounted together with the packaged sensor for comparison. a Photograph of an unmanned drone carrying the wireless sensing system (marked in the red dashed ellipse). b The frequency shift of the selected resonance mode when the drone flew in a selected loop; the starting and ending positions are marked. The resonance frequency at the starting position is set to be zero. The color bar represents the amount of frequency shift. The background image comes from Google Maps. Bar: 50 m. c Comparison of the measured frequency shift with the results from a commercial thermometer. The increasing numbers denote the positions of the measurements when the drone flew from the starting position to the ending position

