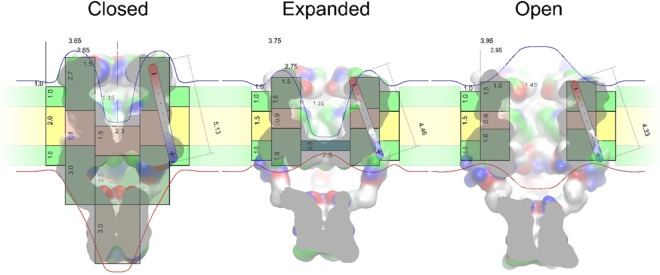
Figure 5.
Estimations of V23T MscL’s changes in dipole and capacitive energies as a result of transitions to the expanded (subconductive) and open states. Simplified cylindrical representations of three main conformations of V23T MscL (closed, expanded, and open) overlaid on atomistic models of respective states presented as surfaces. Grey regions represent high-dielectric (polar) and pink represent low-dielectric (apolar) segments of the protein; cyan domain in the expanded (subconductive) state shows a polar (likely hydrated) occlusion of the pore; green and yellow represent polar and apolar regions of the annular lipids around the protein. Numbers represent approximate thicknesses and diameters of different dielectric segments that undergo conformational changes in nm. The red and blue lines depict equipotential surfaces around the protein and membrane, in this particular case blue line designates positive voltage in the outer (periplasmic) compartment.

