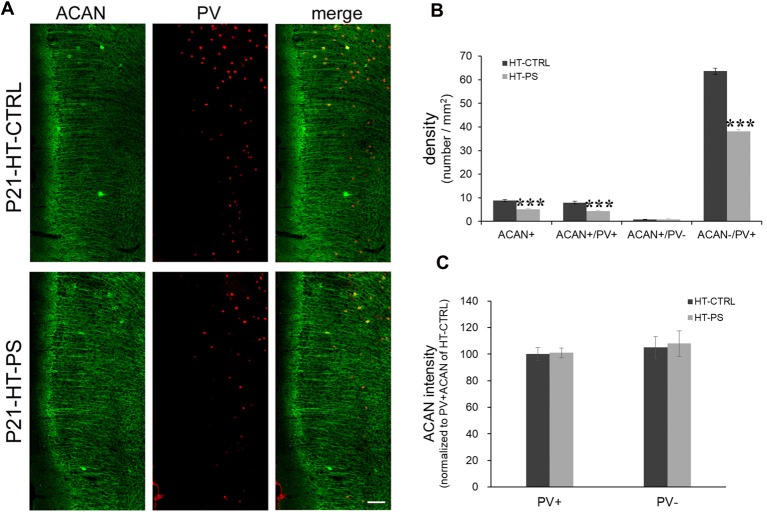
Figure 2.
Density of aggrecan-positive (ACAN+) cells is decreased in the mPFC of GAD67+/GFP offspring with PS. (A) Representative photomicrographs showing the distribution of ACAN-labeled perineuronal nets in the mPFC. Fluorescent images of a coronal section in control GAD67+/GFP offspring (up) and those with (PS; down) at P21 immunostained with ACAN (green) and (PV; red). (B) Quantitative analysis of ACAN+, ACAN+/PV+, ACAN−/PV+ and ACAN+/PV− cells in the mPFC. The number of ACAN+, ACAN+/PV+ and ACAN−/PV+ cells were significantly decreased in the mPFC of subjects with PS compared with controls (HT-CTRL: 17 slices; HT-PS: 13 slices from six mice; t-test, ***P < 0.001). There are no significant differences in the number of ACAN+/PV− cells between subjects with PS and normal control subjects. (C) Quantitative analysis of fluorescence intensity of ACAN in the mPFC of control and stressed mice. There are no significant differences in ACAN intensity between subjects with PS (66 PV+ cells and 13 PV− cells from six mice) and normal control subjects (68 PV+ cells and 16 PV− cells from six mice, 2-tailed t-test). Scale bars: 100 μm. Error bars represent the SEM.

