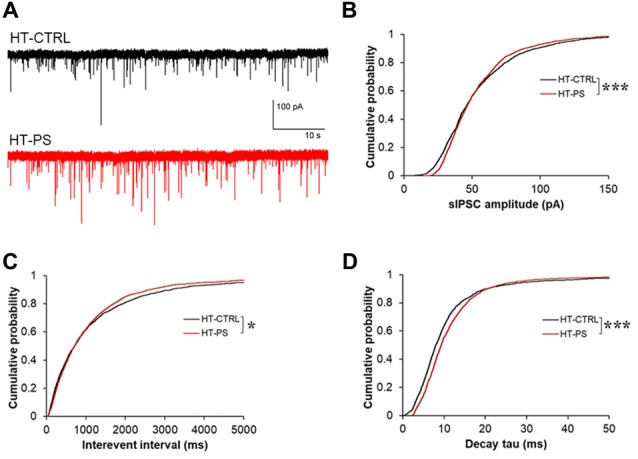
Figure 6.

Change in basic properties of spontaneous inhibitory signaling in GAD67+/GFP mice with PS. (A) Representative traces showing spontaneous IPSC (sIPSC) recorded in layer V pyramidal neurons at –70 mV from mPFC of HT-CTRL (black) and HT-PS (red) mice. (B–D) Cumulative plots of sIPSC amplitude (B), interevent interval (C) and decay tau (D). *P < 0.05, ***P < 0.001 Kolmogorov-Smirnov test; n = 17 cells from five HT-CTRL mice and n = 17 cells from five HT-PS mice.
