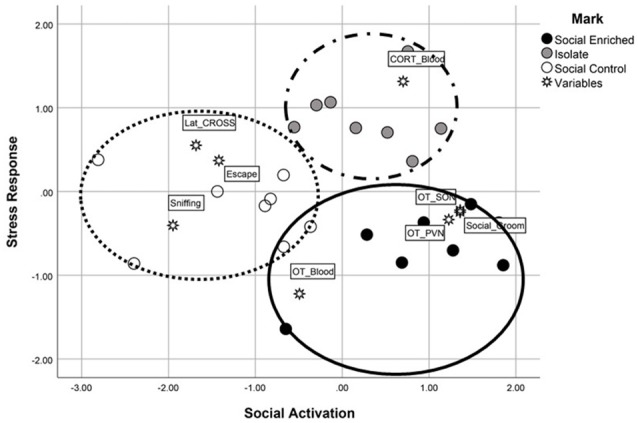
Figure 7.

The multidimensional scaling analysis, an additional statistical evaluation analysis, revealed high discrimination among the three groups. Using the two linear dimensions of social activation and stress responsiveness, the SE animals were characterized by higher social activation and lower stress responsiveness (e.g., higher OT-immunoreactivity, social grooming) whereas the SC animals were characterized by lower social activation responses (e.g., higher number of escape attempts in the social investigation task) and higher stress responsivity (e.g., longer latency to cross the barrier in the problem-solving task). The ISO animals were limited in behavioral responses due to their lack of cagemates during the dark observation phase; however, when the shared variance was subtracted from the scores, their plasma CORT levels placed them high along the stress responsiveness dimension.
