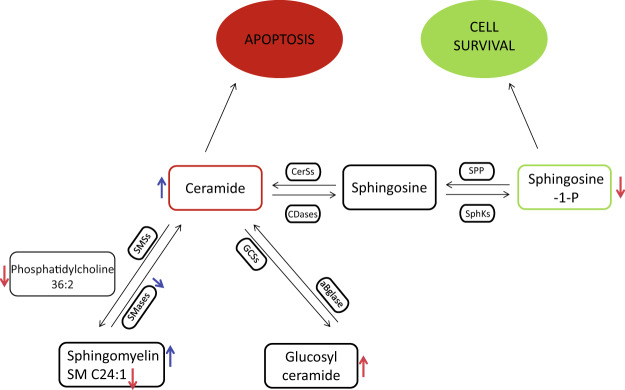
Figure 5.
Schematic results summary. Total SMs tend to increase in patients with AD compared to patients with iNPH, whereas SM C24:1 is significantly decreased; both the SMases (nSMase and ASM) result to be decreased, whereas Cer C24:0 tend to increase. Sphingosine-1-phosphate(S1P) is significantly reduced in AD compared to iNPH patients whereas glucosylceramide (GlcCer)C24:0 is augmented. Red arrows indicate a statistical significant result, whereas blue arrows indicate an increasing/decreasing trend.

