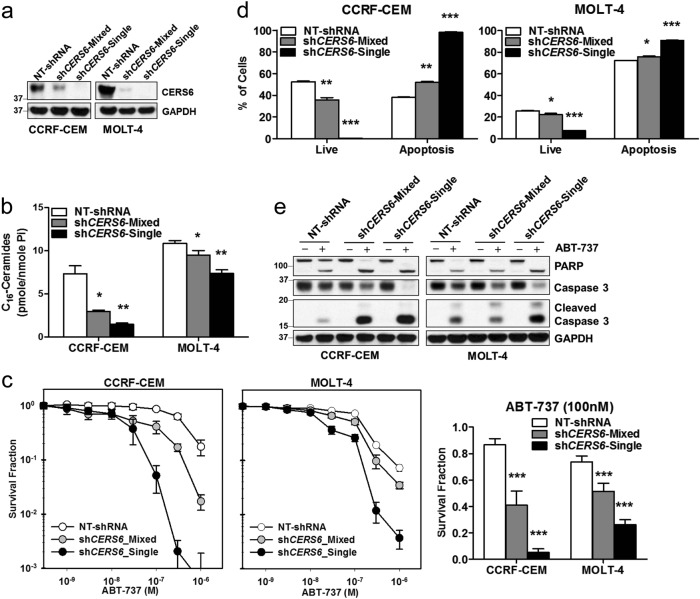
Fig. 2. ALL cells are sensitized to ABT-737 upon CERS6 knockdown.
a CERS6 protein levels in CCRF-CEM and MOLT-4 cells after stably knocking down CERS6 using shRNA (NT-shRNA non-targeted shRNA, shCERS6-Mixed shRNA against CERS6 and selected with puromycin, shCERS6-Single shRNA against CERS6 and selected with puromycin followed by repopulation from a single cell). GAPDH was used as a loading control. b C16-Ceramide levels (pmole/nmole of inorganic phosphate) in ALL cells after CERS6 knockdown. Ceramide levels were quantitated by HPLC/MS/MS (1.5 ± 0.1 vs 7.3 ± 0.9 pmole/nmole Pi for CCRF-CEM and 7.4 ± 0.4 vs 10.9 ± 0.3 pmole/nmole Pi for MOLT-4; n = 3). c Knockdown of CERS6 in CCRF-CEM and MOLT-4 sensitized the cells to ABT-737. Dose response curves showing concentration of ABT-737 on x-axis and survival fraction on y-axis on a log10 scale. Bar graphs depict survival fractions at 100 nM of ABT-737 in both cell lines (5.2 ± 2.7% vs 86.6 ± 4.6% survival at 100 nM ABT-737 for CCRF-CEM and 26.1 ± 3.8% vs 73.6 ± 4.6% survival at 100 nM ABT-737 for MOLT-4; n = 6). d Annexin-V apoptosis assay by flow cytometry showing the percentage of live and apoptotic cells upon ABT-737 treatment (1 µM for 16 h) in CCRF-CEM or MOLT-4 cells with CERS6 knockdown in comparison to cells transduced with NT-shRNA (98.0 ± 0.4% vs 38.0 ± 0.4% for CCRF-CEM and 90.8 ± 0.3% vs 72.1 ± 0.3% for MOLT-4; n = 3). e CERS6 knockdown in CCRF-CEM or MOLT-4 cells show higher levels of cleaved PARP and cleaved caspase-3 on ABT-737 treatment (1 µM for 16 h). GAPDH was used as a loading control * p < 0.05, ** p < 0.01, *** p < 0.001

