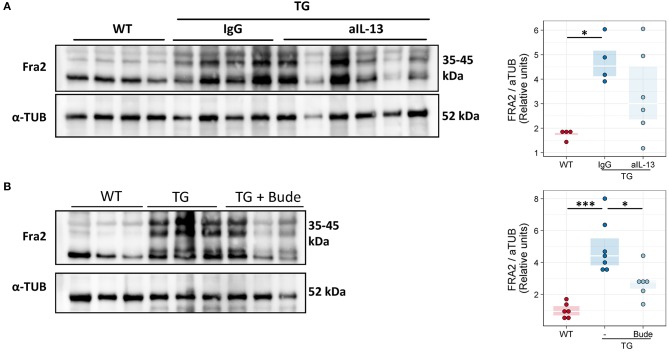
Figure 10.
Fra2 protein levels decrease after anti-inflammatory treatment of Fra2 TG mice. Western blot analysis and quantification of Fra2 in the lungs of (A) WT and Fra2 TG mice treated with isotype control (IgG) or anti-IL-13 antibodies (aIL-13); or (B) WT and Fra2 TG mice treated with or without Budesonide; one representative of two western blots is shown. α-Tubulin (α-TUB) is shown as a loading control. (Uncropped scans of the original membranes can be found in Figures E5, E6); n = 5–8. *p < 0.05, ***p < 0.001.

