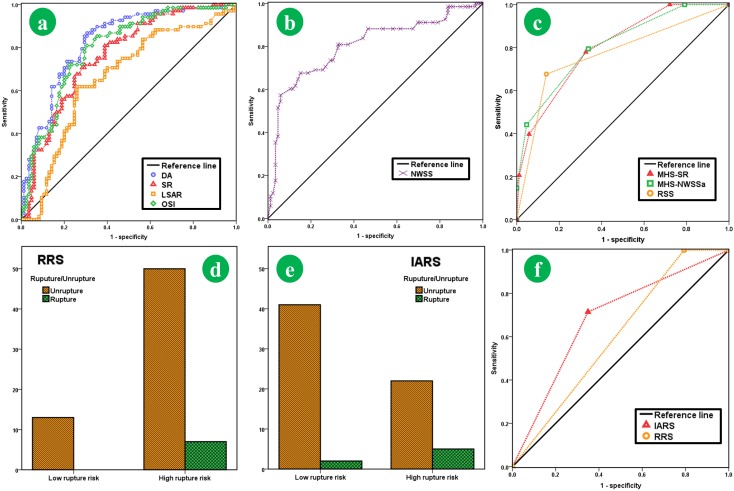
FIGURE 4.
The ROC curves of key parameters (DA, SR, LSAR, OSI, and NWSS) were presented here (a,b). The cut-off values for SR, DA, NWSSa, LSAR, OSI, and RRT were 2.3, 35, 0.24, 0.30, 0.008, and 5.3, respectively. The ROC curves of the IARS-SR, IARS-NWSS, and RRS suggested that the AUC of IARS-SR (AUC 0.81) was larger than IARS-NWSS (AUC 0.79) and RRS (AUC 0.77), which suggested that the IARS-SR had higher accuracy to discriminate the ruputre statue (c). For the follow-up group, the distributions of the ruptured aneurysm and unruptured aneurysm in each stratification system were presented (d,e). The IARS has higher AUC (AUC for the IARS and the RRS was 0.723 and 0.673, respectively.

