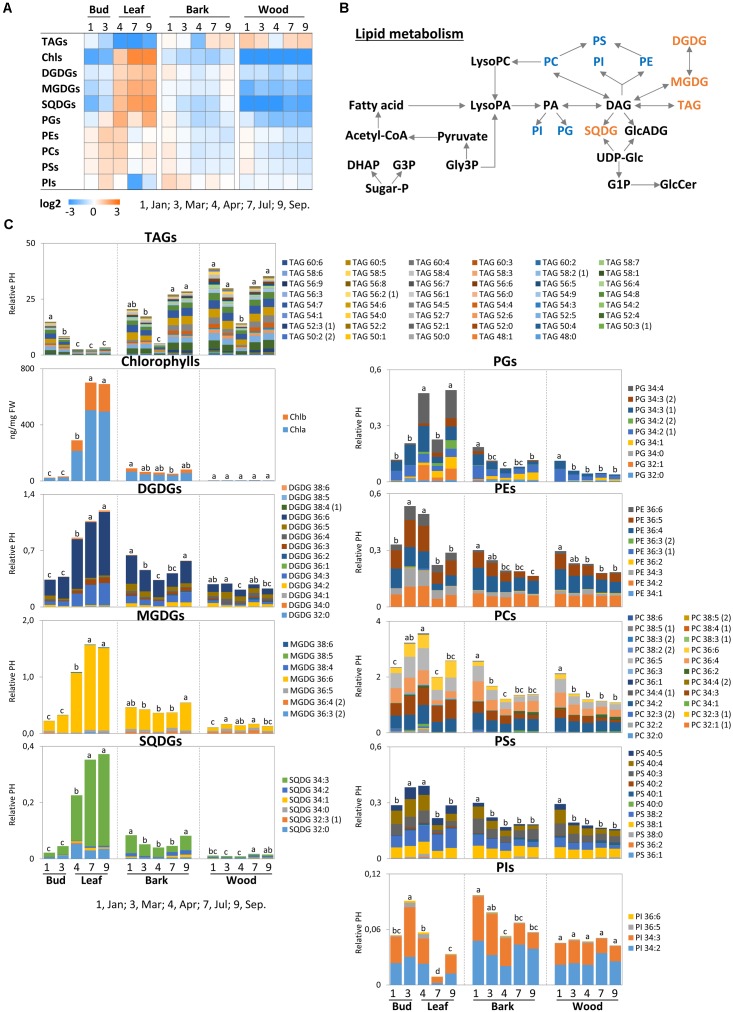
FIGURE 8.
Metabolic changes in lipid metabolism. Changes of the selected metabolites in lipid metabolism in poplar twigs during annual growth. (A) Changes of total lipid in each class. (B) Lipid metabolic pathway according to Gardocki et al. (2005); Boudière et al. (2014), Guschina et al. (2014); Kobayashi (2016), and Xue et al. (2017). (C) Changes of individual lipid molecular species in each class. Log2 ratios of fold changes from the average value of all organs/tissues and seasons are given by shades of red or blue colors according to the scale bar. Data represent mean values of five biological replicates in each organ/tissue for each seasons. Different letters represent statistically significant differences (P < 0.05) between seasons in each organ/tissue with the total lipid values in each class using Tukey’s test. Statistical analysis of individual lipid species was performed using Tukey’s test (Supplementary Table S2). Relative PH, relative peak height; DHAP, dihydroxyacetonephosphate; Sugar-P, sugar-phosphate; G3P, glucose-3-phosphate; Gly3P, glycerol-3-phosphate; LysoPC, lysophosphatidylcholine; LysoPA, lysophosphatidicacid; GlcADG, glucoronosyldiacylglycerol; UDP-Glc, uridine-diphosphate-glucose; G1P, glucose-1-phosphate; GlcCer, glucosylceramides; TAGs, triacylglycerides; Chls, chlorophylls; MGDGs, monogalactosyldiacylglycerols; DGDGs, digalactosyldiacylglycerols; SQDGs, sulfoquinovosyldiacylglycerols; PGs, phosphatidylglycerols; PEs, phosphatidylethanolamines; PCs, phosphatidylcholines; PSs, phosphatidylserine; PIs, phosphatidylinositols; DAGs, diacylglycerols.

