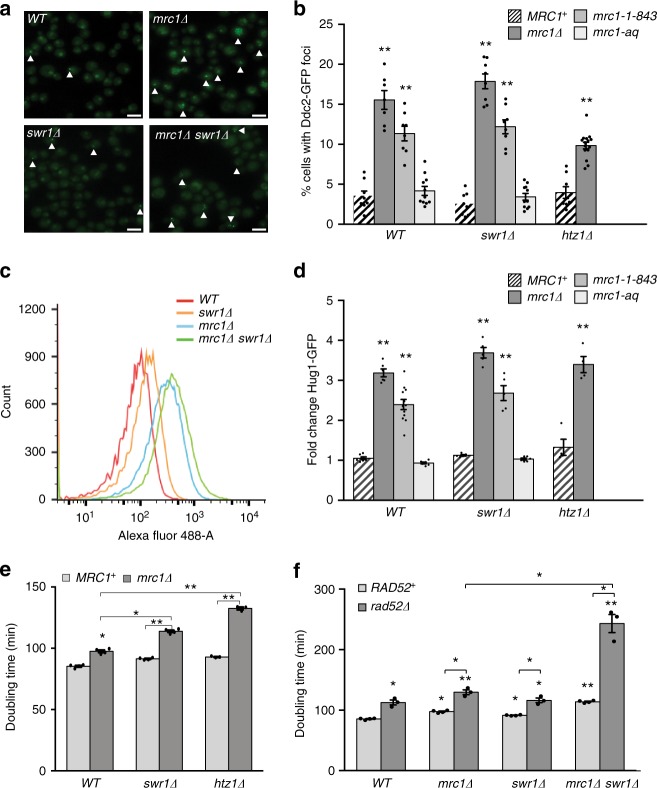
Fig 3.
swr1Δ/htz1Δ mutations synergistically increase growth defects but not checkpoint activation in combination with a mrc1Δ mutation. a Ddc2-GFP foci in the indicated strains. White triangles indicate Ddc2-GFP foci. Scale bar, 10 μM. b. Distribution of Ddc2-GFP foci in strains with various mrc1 mutations with and without an additional swr1Δ or htz1Δ mutation. The average percentage of cells with Ddc2-GFP foci was calculated from at least eight images with ~200 cells each, from at least two independent experiments. The error bars represent the standard error of the mean. c FACS-based measurement of Hug1-GFP induction in individual cells can be used to visualize the relative Hug1-GFP induction for cell populations. d Hug1-GFP induction in strains with various mrc1 mutations with or without the swr1Δ or htz1Δ mutation. The fold changes were calculated by dividing the average Hug1-GFP level for each strain by the average Hug1-GFP level of the wild-type strain measured by FACS in the same experiment. A minimum of four and a maximum of 12 independent cultures derived from a minimum of two independent strain isolates for each genotype were analyzed. The mean fold changes were calculated, and the error bars represent the standard error of the mean. e, f Doubling times of the indicated strains. The mean doubling time and standard error were calculated from the doubling times of a minimum of three independent cultures derived from a minimum of two independent isolates of each genotype. In (b, d, e, f), individual observations are shown as dots overlaid on the bar graphs, and asterisks represent significant differences with respect to the wild-type strain (unless otherwise indicated) as follows: * p < 0.005, ** p < 0.0005 (two-tailed t-test)

