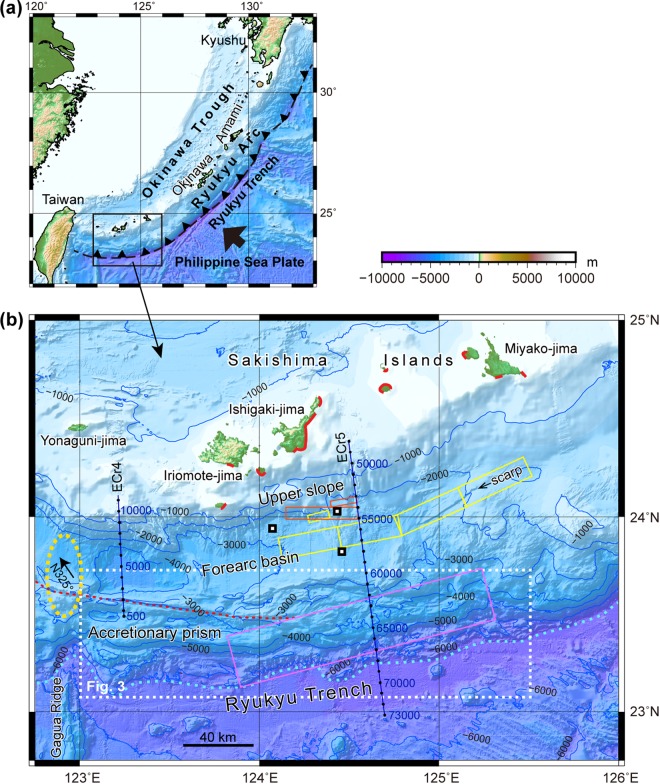
Figure 1.
Location and bathymetry of the southwestern Ryukyu Arc. (a) Index map of the Ryukyu Arc. (b) Bathymetry of the southwestern Ryukyu Arc. Coasts marked in red contain tsunami deposits and boulders9,10. Previously proposed source models of the 1771 tsunami are indicated by orange23,24, yellow25 and pink26 rectangles. Blue lines indicate the seismic survey lines with CDP numbers. Small squares indicate the locations of sediment cores43. The orange dotted line is a strike-slip fault and the sky blue dotted lines indicate the deformation front. The yellow dashed oval shows an uplift zone in the accretionary prism and the forearc basin, and the arrow in the oval indicates the azimuth of the relative motion between Yonaguni-jima and the PSP31. The maps were produced using GMT 4.546 and Adobe Illustrator CS6.

