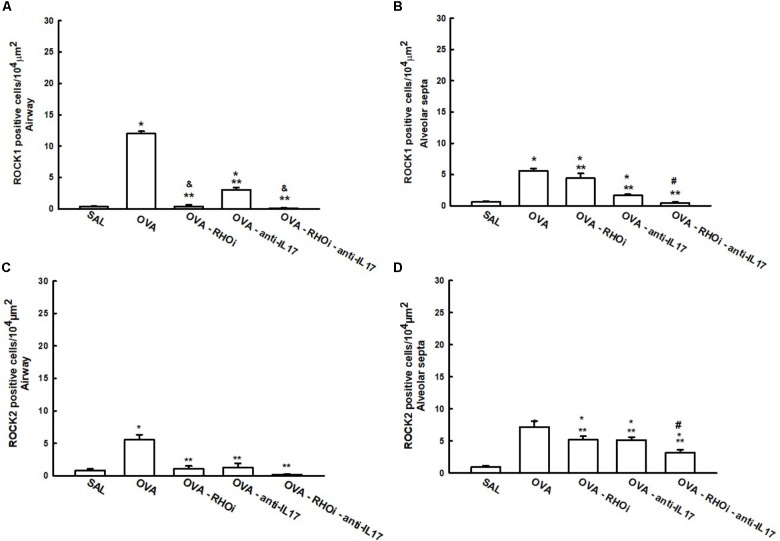
FIGURE 4.
Effects of ROCK inhibitor and anti-IL17 in cells involved in hyper-responsiveness. (A) ROCK1 in the airway, (B) ROCK1 in the alveolar septa, (C) ROCK2 in the airway, and (D) ROCK2 in the alveolar septa, levels expressed as numbers of positive cells/104 μm2. ∗p < 0.05 compared to the SAL group; ∗∗p < 0.05 compared to the OVA group; #p < 0.05 compared to OVA-RHOi and OVA-anti-IL17 groups; & p < 0.05 compared to the OVA-anti-IL17 group.

