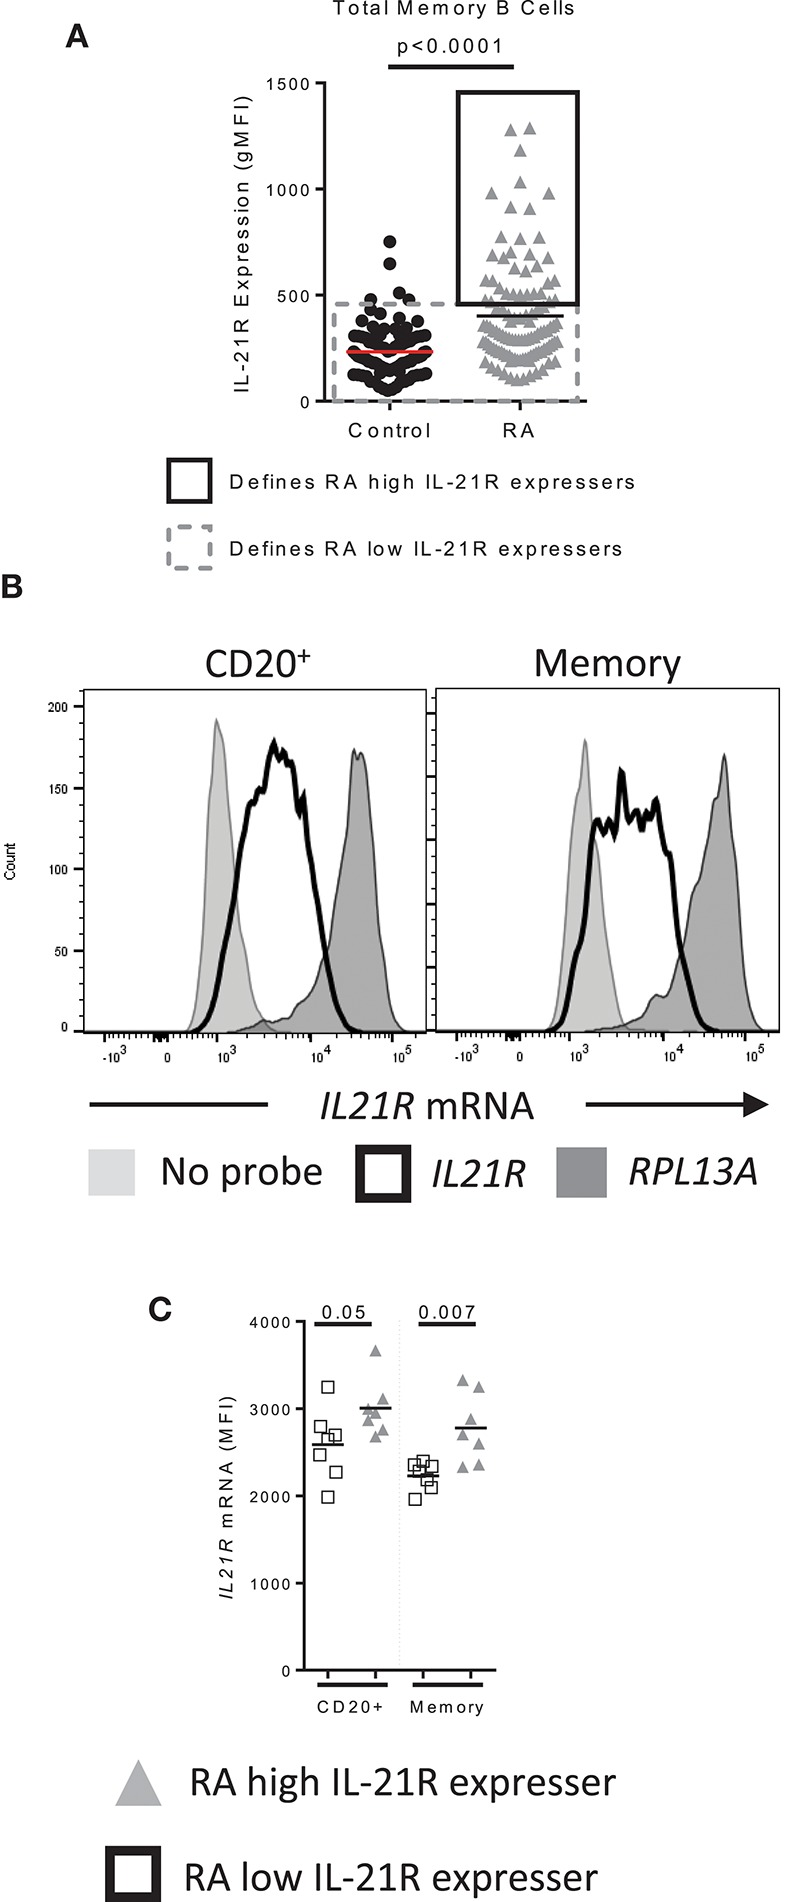
Figure 6.

IL-21R transcript levels are increased in RA subjects with high levels of IL-21R (A) Data from Figure 1A used to show how RA high IL-21R expressers and RA low IL-21R expressers are defined. RA high IL-21R expressers in the solid black box express IL-21R at levels two times the standard deviation of the mean of the control samples. RA low IL-21R expressers in the gray dashed box are less than two times the standard deviation of the mean of the control samples. (B) Representation of the positive control probe (RPL13A) (dark gray histogram), IL21R (black line histogram) and negative control (no probe) (light gray histogram) in CD20+ or memory B cells in a control subject. (C) IL21R mRNA levels in total and memory B cells from RA high IL-21R expressers (gray triangles, n = 7) and RA low IL-21R expressers (white squares, n = 7) Significance was determined using a Mann Whitney U test.
